Also note, if it’s an artifact of P1 vs P2, that I tend to record the results in P1 to P2 order, where P1 is typically the reporting player, and also the winner about 90% of the time.
2 Likes
Yeah, I manually flipped half of the mirror matches around, to counter that effect. However, I think fixing the model will improve the situation.
For the other matchups, I flip the game around to have the earlier character (alphabetically) first, so there shouldn’t be any P1 effects there.
3 Likes
So, here’s a thing… Not sure what to make of it, honestly.
I factored out the standard deviation of the per-matchup variance, and graphed it up separately. Here’s the adjusted matchup chart, plus the standard devs.

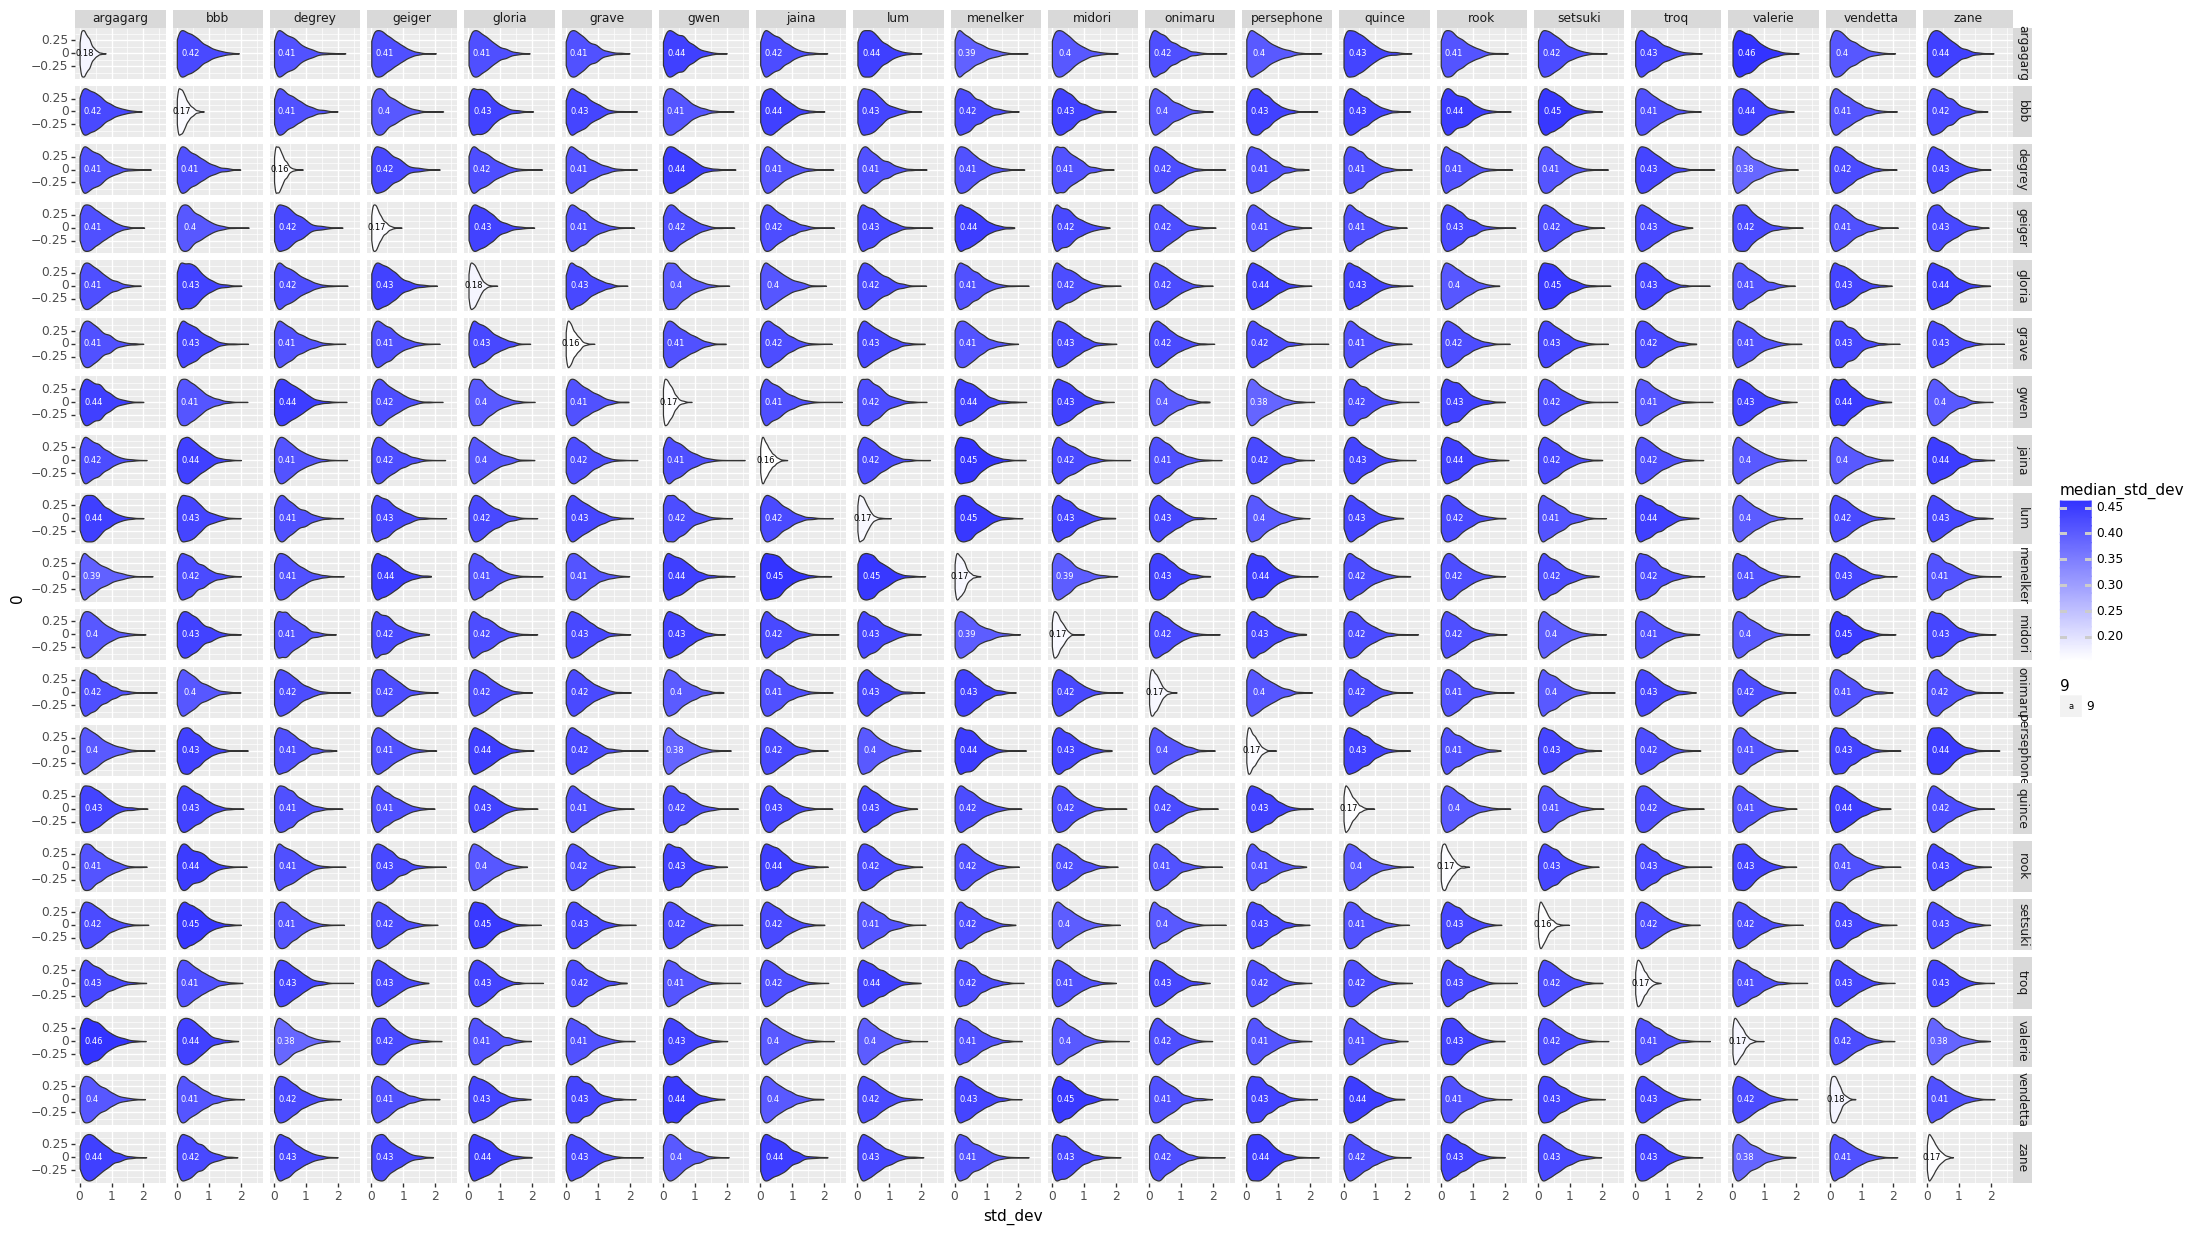
Things that are odd: most of the std devs are basically 0.4… Except mirror matches which are ~0.2?
The Model
data {
    int<lower=0> NPT; // Number of player/tournaments
    int<lower=0> NG; // Number of games
    int<lower=0> NMG; // Number of mirror-games
    int<lower=0> NM; // Number of non-mirror matchups
    int<lower=0> NMM; // Number of mirror matchups

    int<lower=0, upper=NPT> prev_tournament[NPT]; // Previous tournament for player/tournament

    int<lower=0, upper=1> win[NG]; // Did player 1 win game
    int<lower=1, upper=NPT> pt1[NG]; // Player/tournament 1 in game
    int<lower=1, upper=NPT> pt2[NG]; // Player/tournament 2 in game
    int<lower=1, upper=NM> mup[NG]; // Matchup in game

    int<lower=0, upper=1> m_win[NMG]; // Did player 1 win mirror-match
    int<lower=1, upper=NPT> m_pt1[NMG]; // Player/tournament 1 in mirror-match
    int<lower=1, upper=NPT> m_pt2[NMG]; // Player/tournament 2 in mirror-match
    int<lower=1, upper=NM> m_mup[NMG]; // Matchup in mirror-match

}
parameters {
    vector[NPT] skill_adjust; // Skill change before player/tournament
    vector[NM] mu; // Matchup value
    vector<lower=0>[NM] muv; // Matchup variance
    vector<lower=0>[NMM] mmv; // Mirror-matchup variance
}
transformed parameters {
    vector[NPT] skill;

    for (t in 1:NPT) {
        if (prev_tournament[t] == 0)
            skill[t] = skill_adjust[t];
        else
            skill[t] = skill[prev_tournament[t]] + skill_adjust[t];
    }

}
model {
    vector[NG] g_v_raw;
    vector[NMG] mg_v_raw;

    g_v_raw = rep_vector(0, NG);
    mg_v_raw = rep_vector(0, NMG);

    skill_adjust ~ std_normal();
    mu ~ normal(0, 0.5);
    muv ~ normal(0, 0.25);
    mmv ~ normal(0, 0.1);

    g_v_raw ~ std_normal();
    mg_v_raw ~ std_normal();

    win ~ bernoulli_logit(skill[pt1] - skill[pt2] + mu[mup] + g_v_raw .* muv[mup]);
    m_win ~ bernoulli_logit(skill[m_pt1] - skill[m_pt2] + mg_v_raw .* mmv[m_mup]);
}
I honestly don’t folllow what any of these graphs mean.  You’re going to have to break things waaaaay down for me to follow any of this.
1 Like
Hah, fair enough. Don’t have time to do a writeup now, but I’ll work on one.
2 Likes
Ok, lemme try and break this down.
The Setup
Let’s say we’re talking about a specific game, say between myself and @mysticjuicer. If we had perfect information, we might be able to say that I’ll win with some probability p. Conversely, juicer will win with probability 1-p. Because we know something about Yomi, we could say that p probably depends on my skill, juicer’s skill, the difficulty of the particular character matchup, plus some randomness based on the luck of the draw that particular game. The goal of this exercise is to figure out what each of those skills is, what the actual much number is, and approximately how impactful the randomness of the deck is.
So, we have something like:
p ~= skill(pickle) - skill(juicer) + matchup(pers, troq) + variance(pers, troq)
In order to make the math more tractible, we’ll instead use the formula:
ln(p/1-p) = skill(pickle) - skill(juicer) + matchup(pers, troq) + variance(pers, troq)
That natural log ln is what I was talking about earlier with the table of Difference of Log Odds.
The Analysis
Because we don’t know the exact numbers, what we’re trying to do is estimate all of the skills (at points in time, across all players), matchup numbers, and variance amounts, by figuring out what values of those things best explain the actual outcomes we’ve seen in the Yomi historical data. We do that by basically taking a guess at all those parameters, seeing how well they explain the data, and then adjusting our guess at the parameters. Do that several thousand times and you end up with a bunch of parameter guesses. The graphs are charts of the number of times that we guessed each value for each parameter. The number in the middle of each graph is the median guess.
EDIT: The other relevant thing is that I converted The numbers in both charts out of log-odds space. That means, though, that each chart treats the other factors as irrelevant. That particularly affects the variance chart, where the same size variance in log-odds space will have different size effects on p based on (say) the matchup skew.
I’m confused; it’s a long time since I did any stats, but doesn’t the fact that we are modelling things probabilistically mean that the variance of the draws in a given game shouldn’t be part of p? What’s left to be random other than those variables?
Hrm… The way I was thinking through it was that if we had perfect information, we would know exactly what the skill numbers were and the matchup number was, and that if those were fixed quantities, then we needed some other bit of randomness to “explain” p. But now that you’ve asked that question, I have to say I’m not entirely sure…
I ended up adding the extra factor for variance because I couldn’t figure out how to otherwise account for the variance in mirror matchups. But as I think through the question “What should p when playing a mirror match between equally skilled players”, then answer I come to is pretty clearly “Exactly 0.5”. Which argues, as you’re saying, for removing the extra fudge factor.
So, expect another updated chart, once my machine crunches all of the numbers again.
Perhaps there’s an argument for complicating the model by saying that there is a matchup-specific scaling factor on the skill difference? So, certain matches amplify skill differences more than others? I’m not sure how best to evaluate how accurate one model is over another, though.
It depends, I think, on when you’d expect skill to matter more. If it’s a matter of skill difference having a greater effect in closer matchups, then modelling skill difference as a linear effect on the log odds already does this. You can see this by looking at that log-odds vs. win probability table in the first post: changing the log odds has a greater effect on the probability near the 50/50 mark than it does at the extremes.
I think my theory is that some matchups are more luck-based than others (not that I have enough experience to back that up, but I feel like I’ve heard things to that effect in discussions). If that were true, then it seems like there should be some kind of matchup specific weighing to the skill effect. Not sure if a multiplicative scale is the right thing, though.
A multiplicative scale means you don’t have to worry about the sign of the skill difference, so it seems like a reasonable starting point for checking which matchups are affected.
@vengefulpickle , would you please give me one of those cool personalized charts? I would like to see if I have made any progress, or if I am just spinning my wheels. Thanks. Happy holidays!
Yes please me too
You can always check your historical ELO too, fellas.
Yeah, I have done that. The lines should be similar, but I am still curious.
1 Like
Yeah, can do. I’m away from my dev machine, but I’ve got variance charts waiting for me when I get back, and I’ll bang out a few more skill histories as well.
1 Like
I don’t know if this is helpful or not but the central value of standard deviations of mirror matches (0.16-0.17) is approximately the square of the non-mirror standard deviations (0.40-0.41).
I feel like maybe I should be able to spin a yarn about what this means in terms of the model but to be honest I just thought it was interesting. However if this observation helps tweak the model in the right direction I reserve the right to come back and make this post look smarter 
2 Likes
I got a version of the model working that accounts for varying effects due to skill based on matchups. I’m not sure what to make of it yet, but here’s the charts.
Matchup
This is basically the same format as previous charts, and the numbers look similar (by eyeball, anyway)

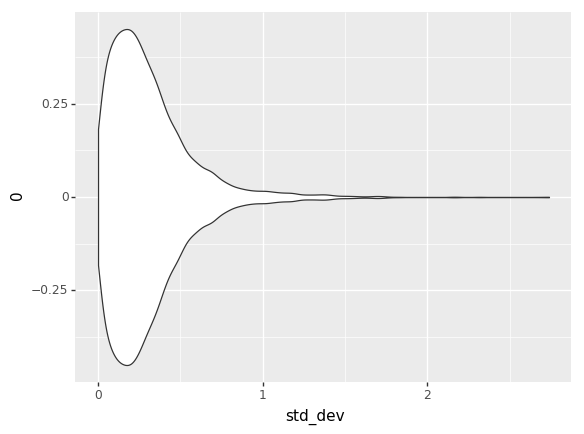
Skill Effect Modifier
This chart is measuring the scaling factor that is applied to the difference in player skills. This factor varies per matchup. A value of 1 would mean that the skill difference affects the odds as described in my earlier explanatory post. A value less than 1 decreases the effect of a skill gap, and a value greater than 1 increases the effect of the skill gap.
My interpretation is that a matchup with a low skill multiplier is one that has high variance in play, and vice versa.
Top 10 Highest Variance MUs
| Char 1 | Char 2 | Median Skill Multiplier |
|---|---|---|
| onimaru | zane | 0.038801 |
| quince | quince | 0.051072 |
| grave | onimaru | 0.055356 |
| degrey | quince | 0.062899 |
| bbb | bbb | 0.063510 |
| lum | menelker | 0.064327 |
| bbb | troq | 0.064415 |
| onimaru | rook | 0.064824 |
| persephone | persephone | 0.076867 |
| gwen | onimaru | 0.081619 |
Top 10 Lowest Variance Matchups
| Char 1 | Char 2 | Median Skill Effect |
|---|---|---|
| geiger | gloria | 0.659470 |
| onimaru | persephone | 0.664453 |
| grave | jaina | 0.678687 |
| geiger | jaina | 0.683435 |
| bbb | valerie | 0.699217 |
| vendetta | vendetta | 0.780808 |
| gwen | jaina | 0.801282 |
| argagarg | persephone | 0.880664 |
| jaina | quince | 0.912223 |
| lum | onimaru | 1.238238 |
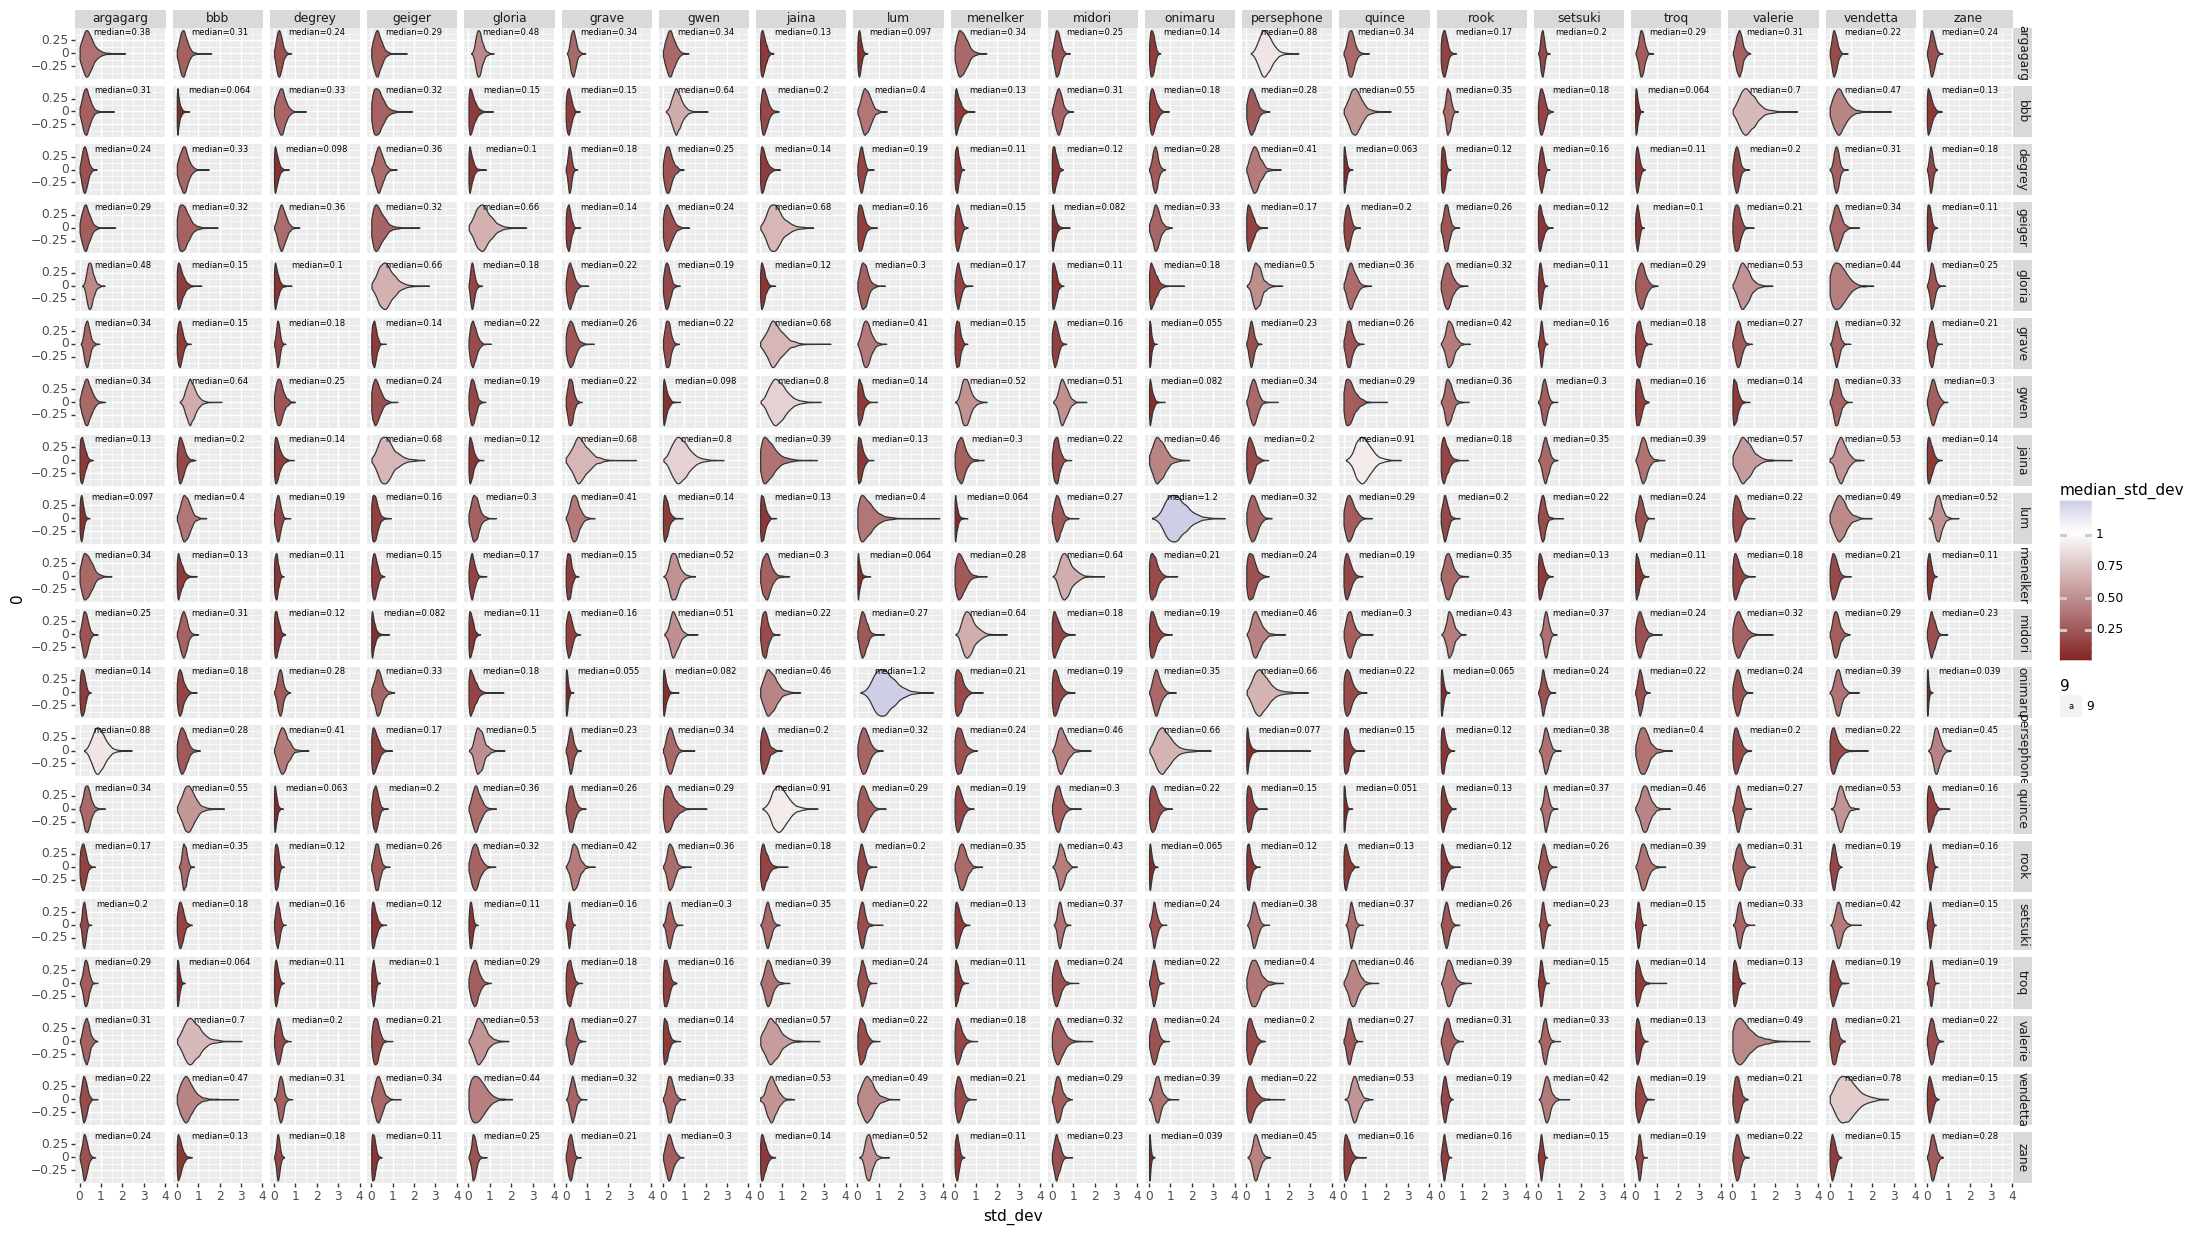
One thing that seems odd to me in this is that overall, most matches have the skill effects scaled down. Overall all matches, the distribution is:
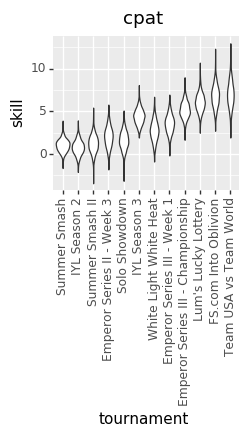
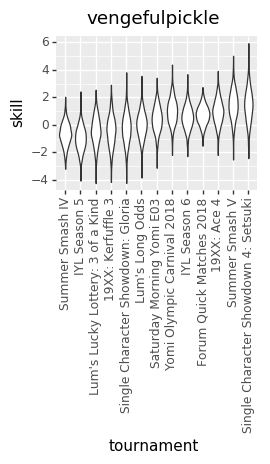
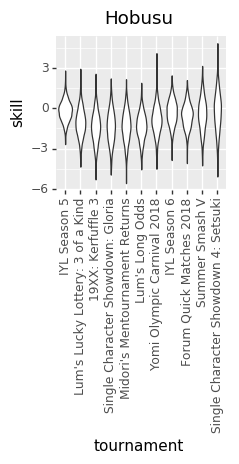
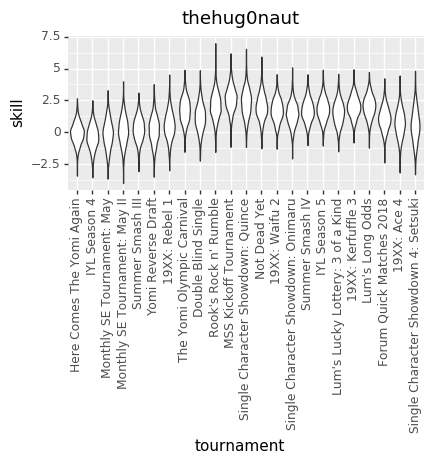
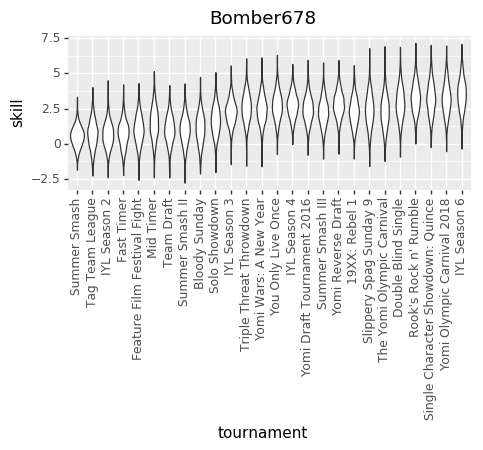
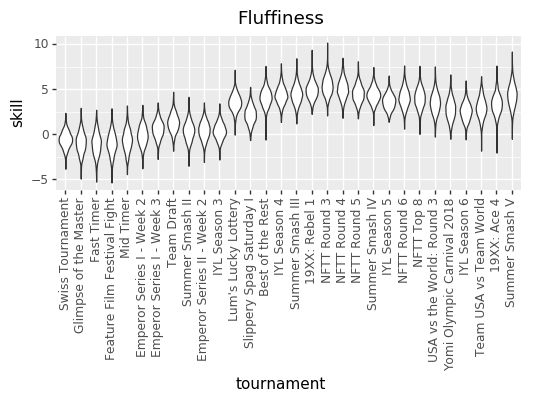
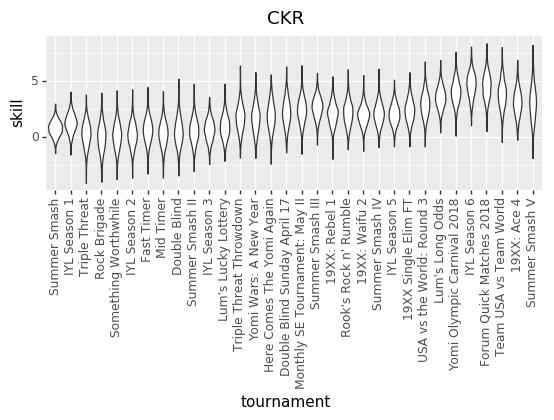
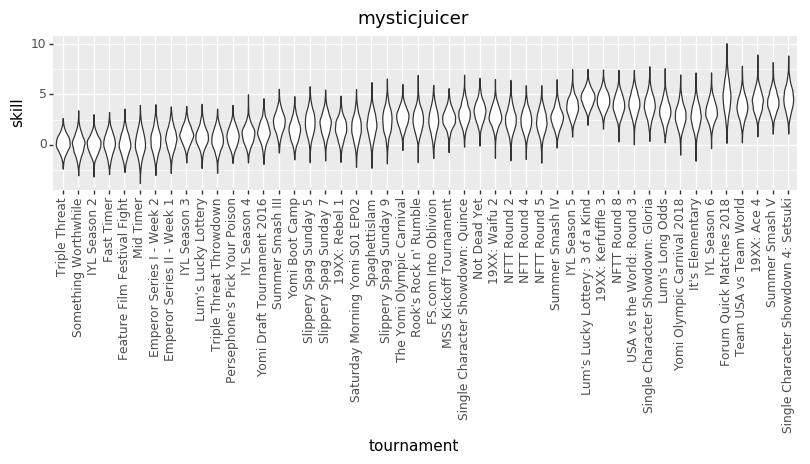
And here are some updated individual skill charts. The biggest change, I think, is that the model is less certain about players’ skills in each tournament.
cpat
vengefulpickle
Hobusu
thehug0naut
Bomber678
Fluffiness
CKR
3 Likes
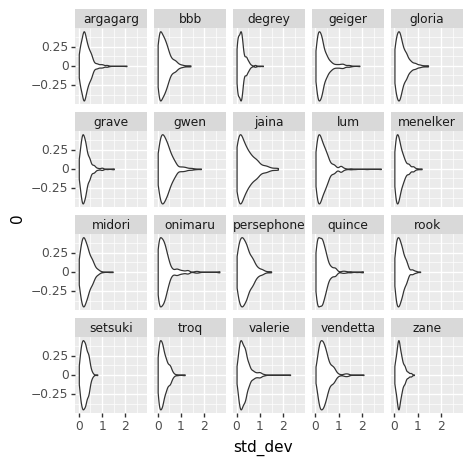
And, for grins, here’s the aggregate skill effect for each character
3 Likes