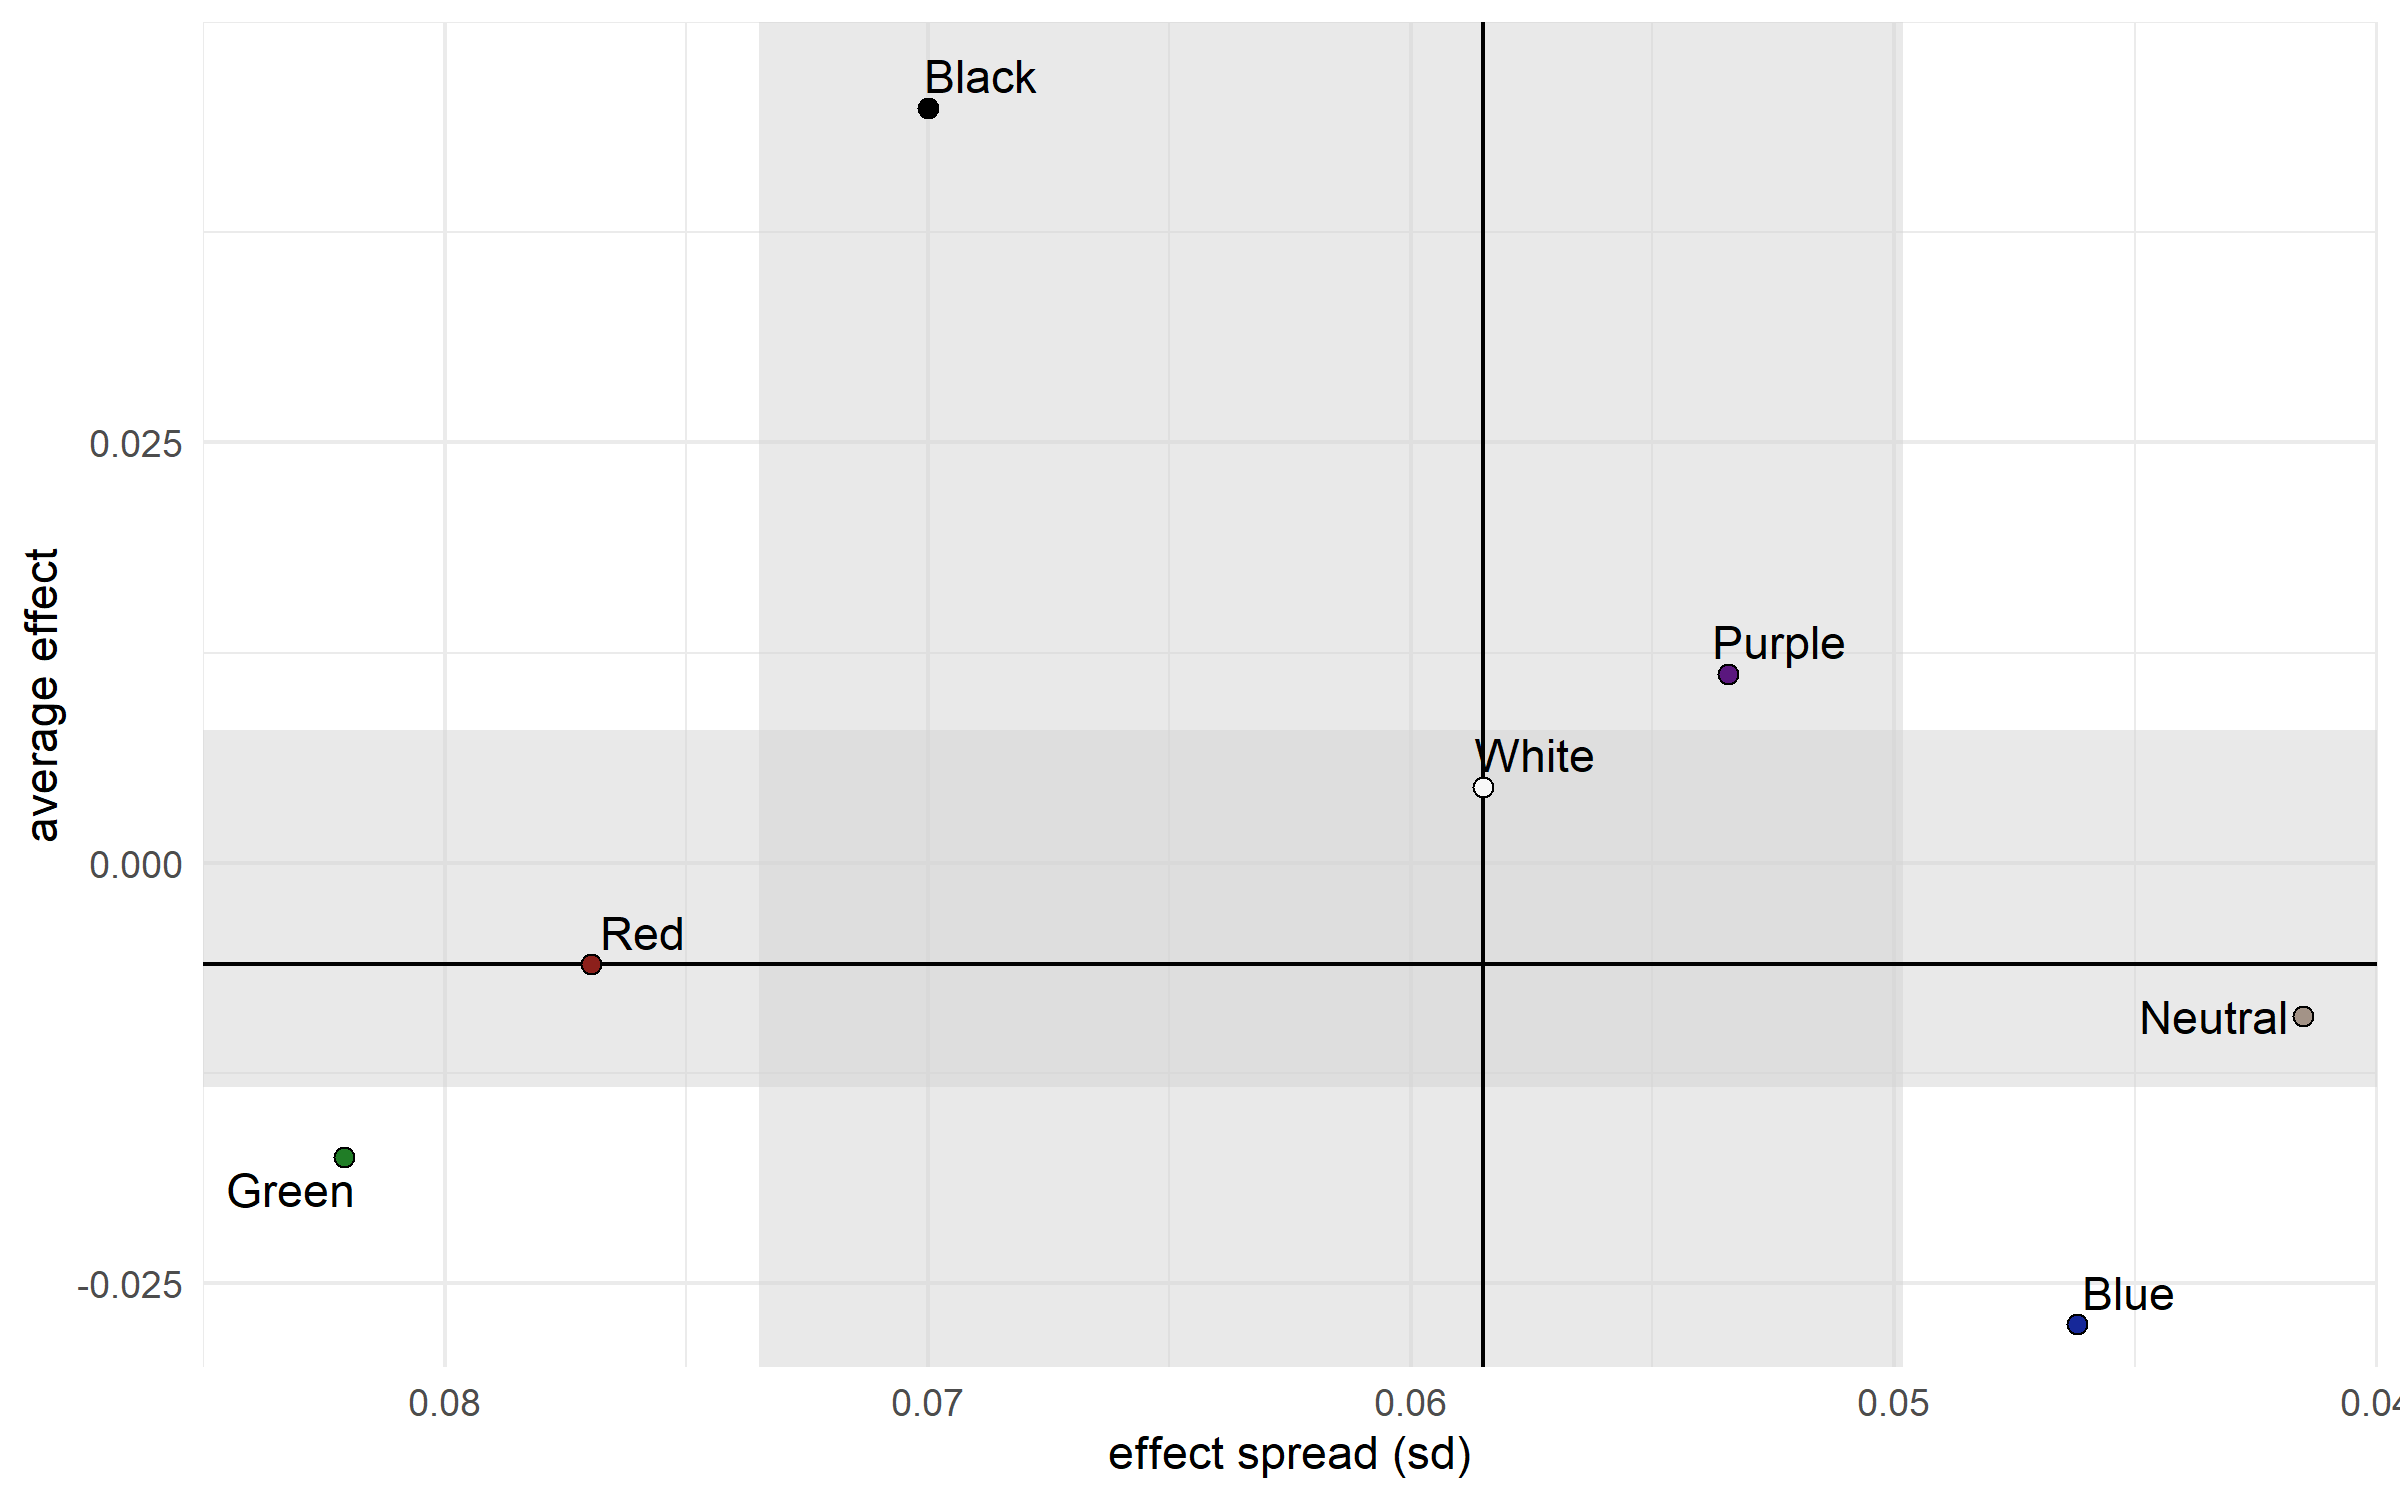
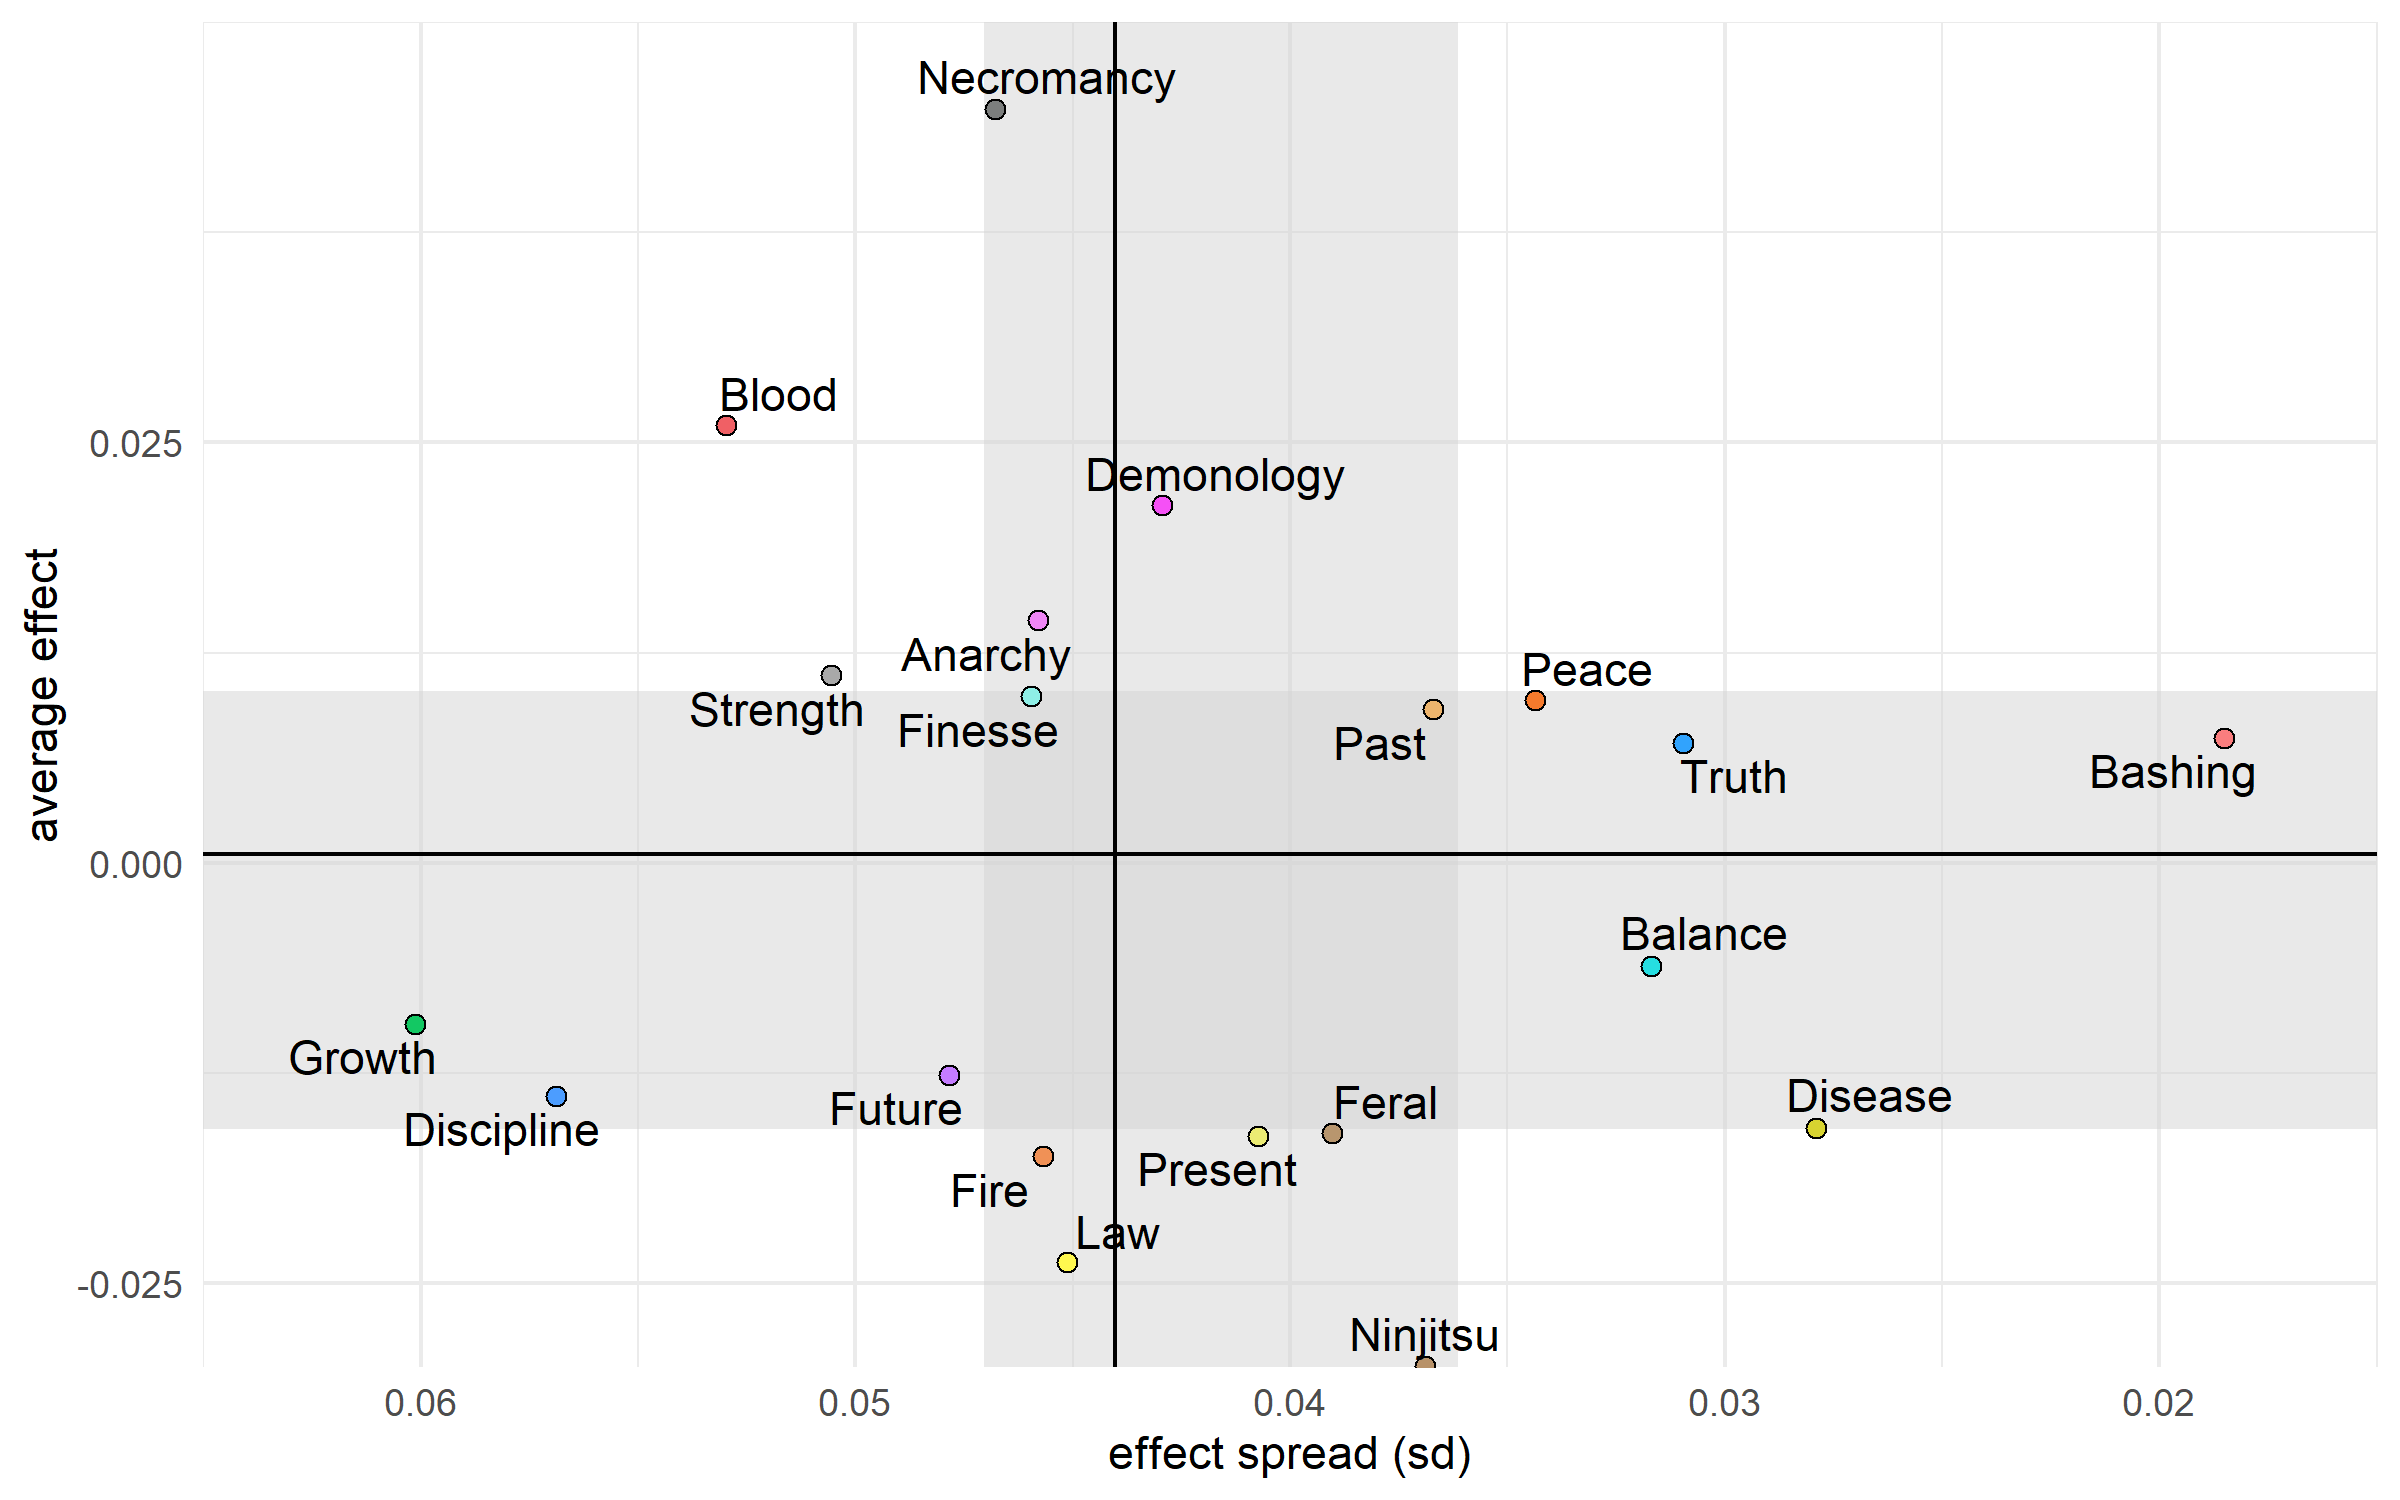
Based on the plot @mysticjuicer linked to here, a first attempt at 2D tier plots.
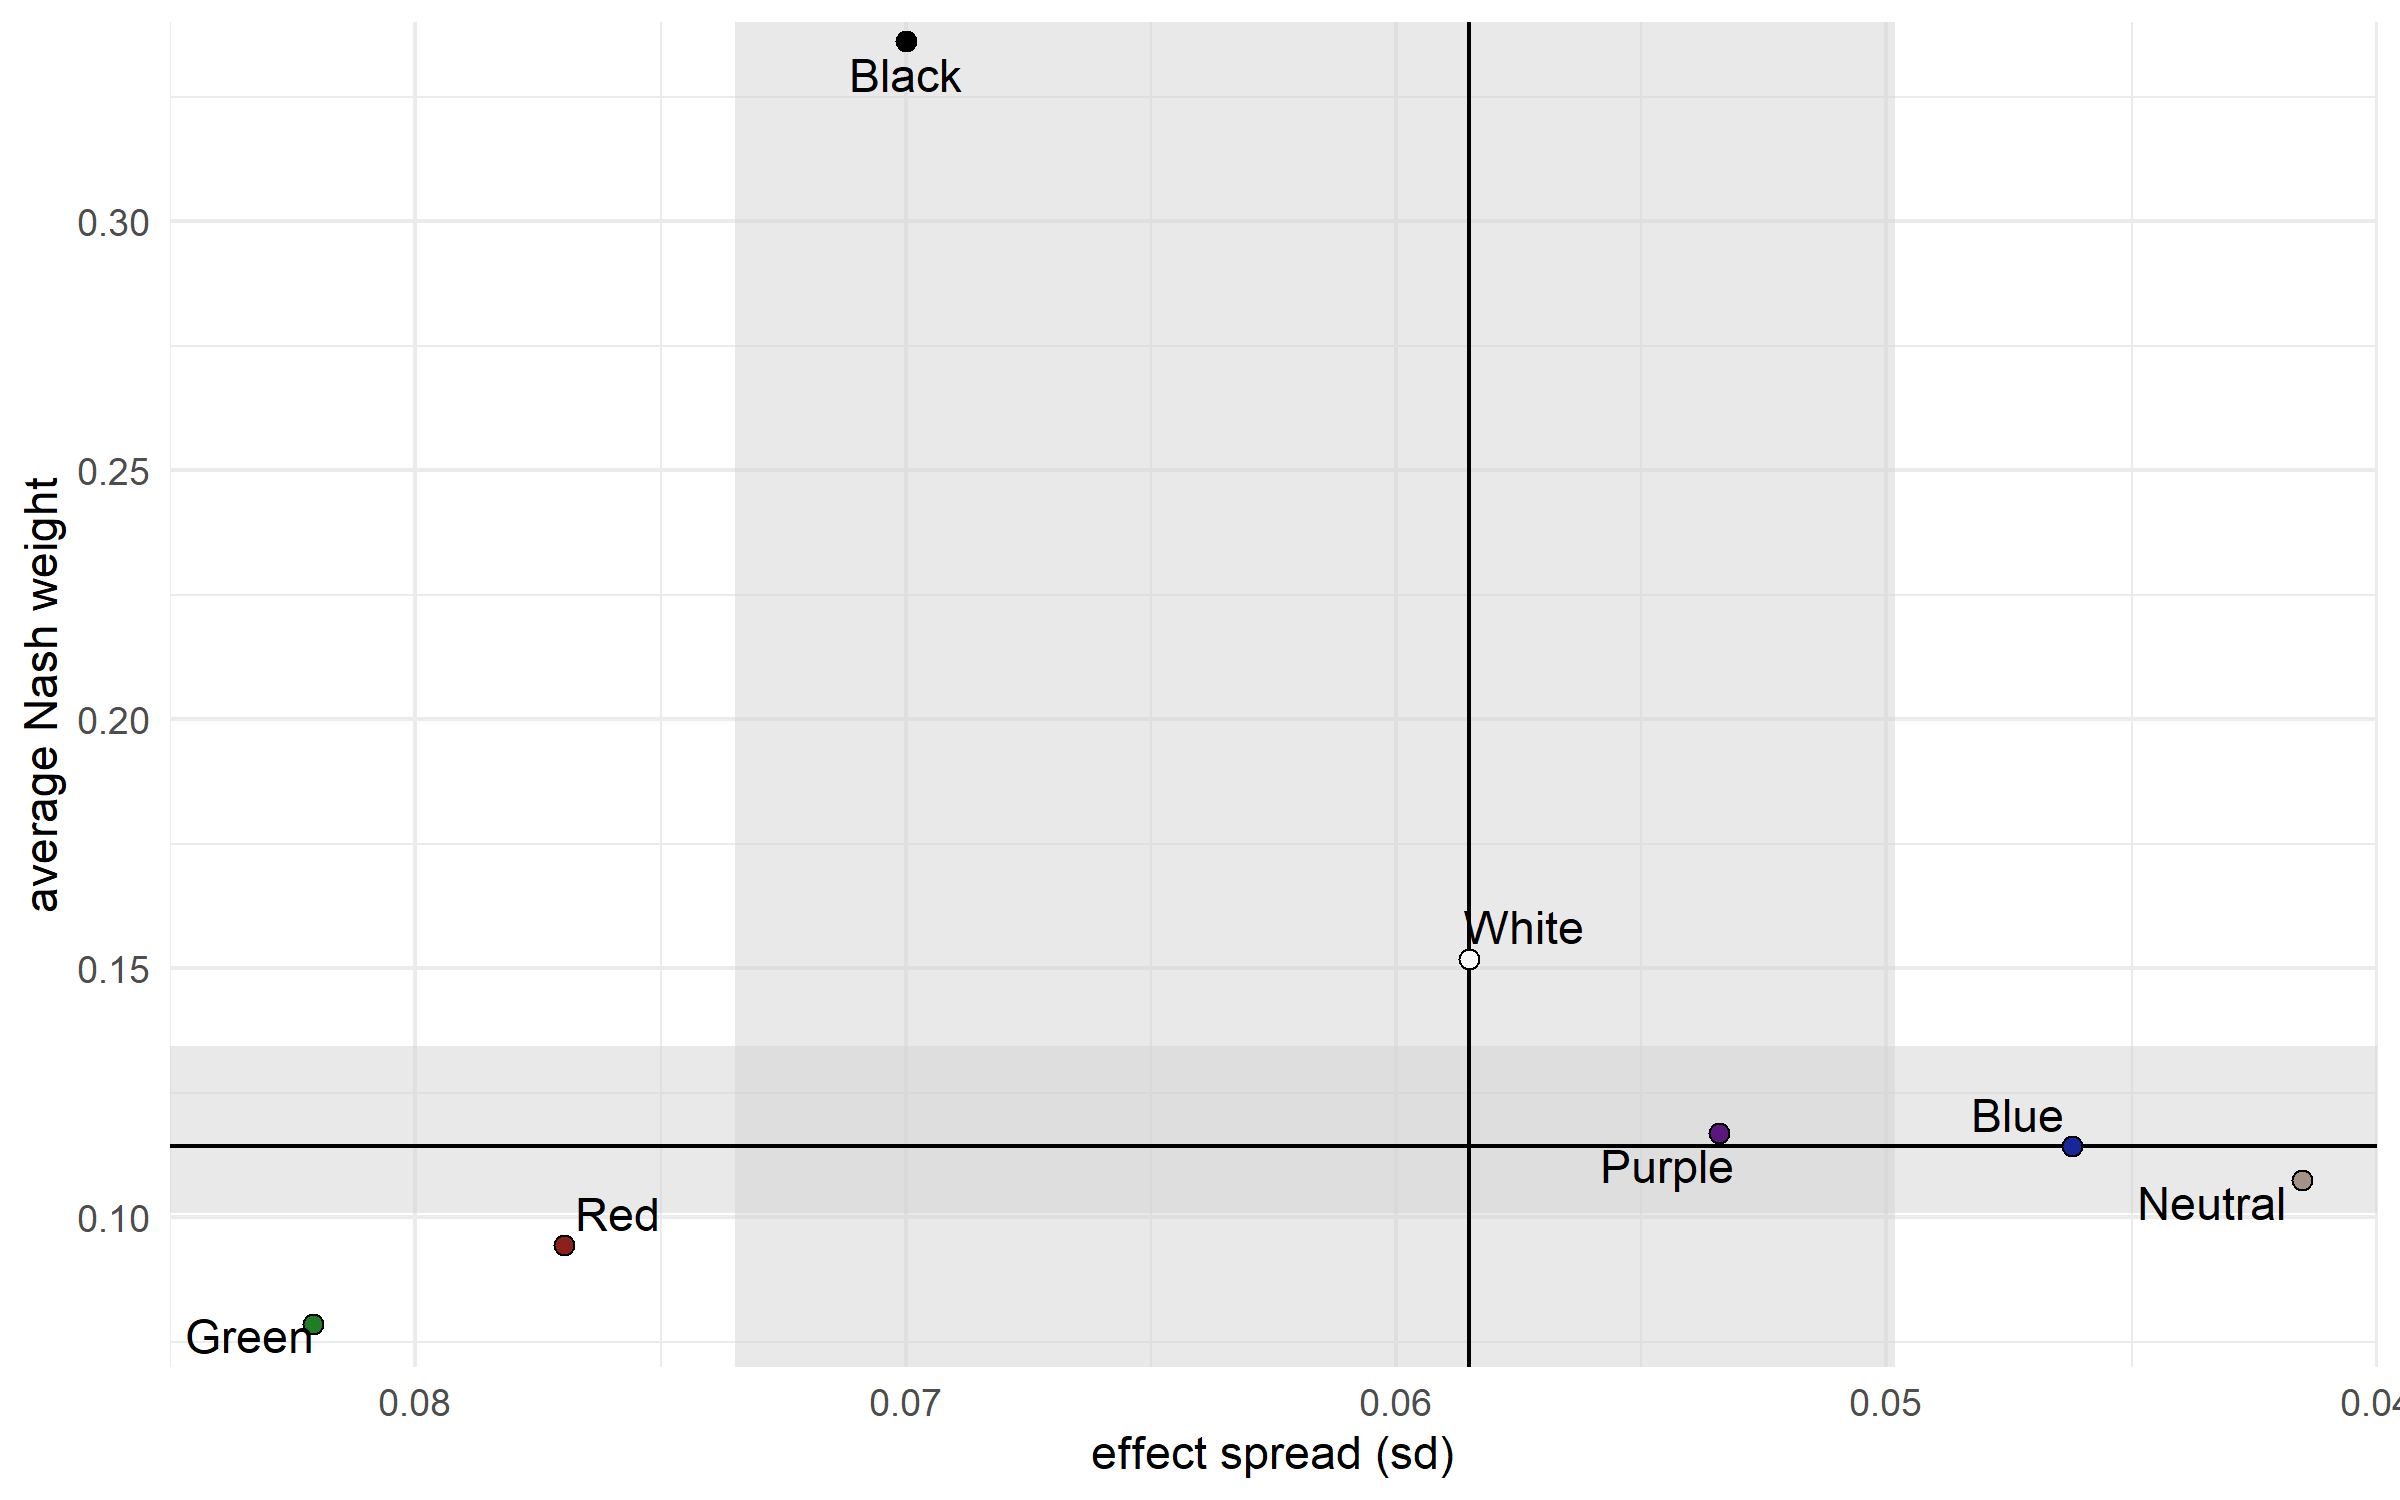
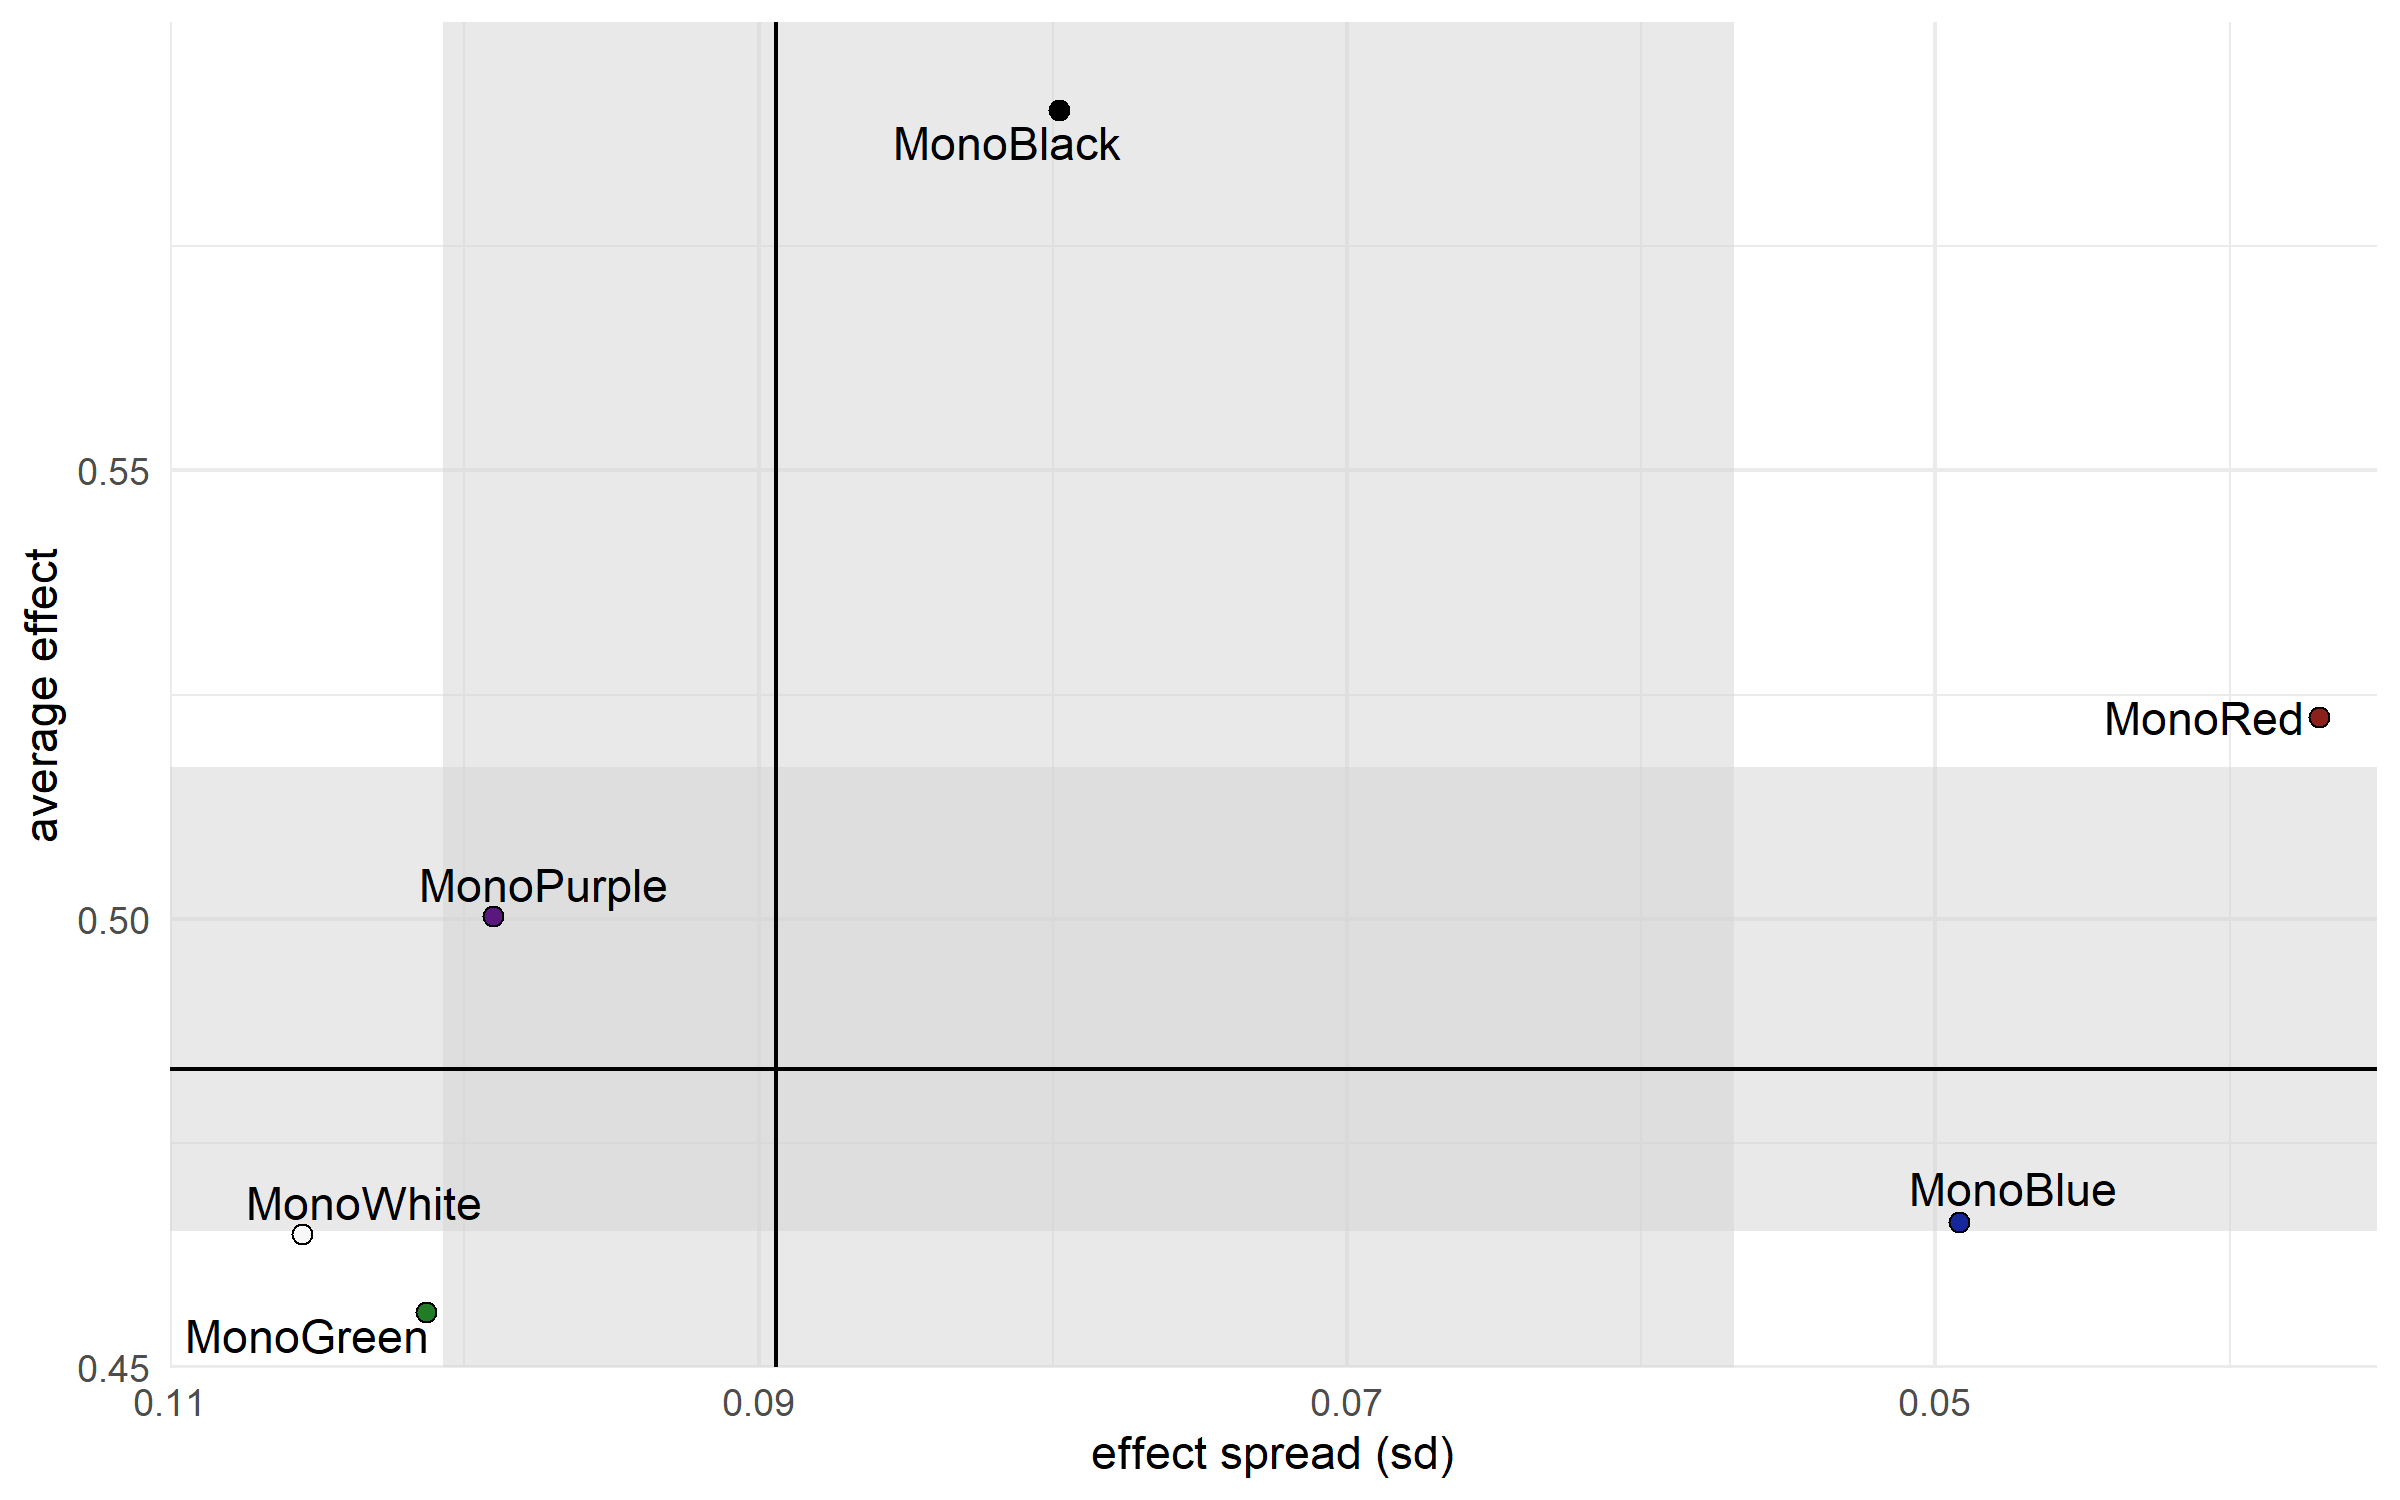
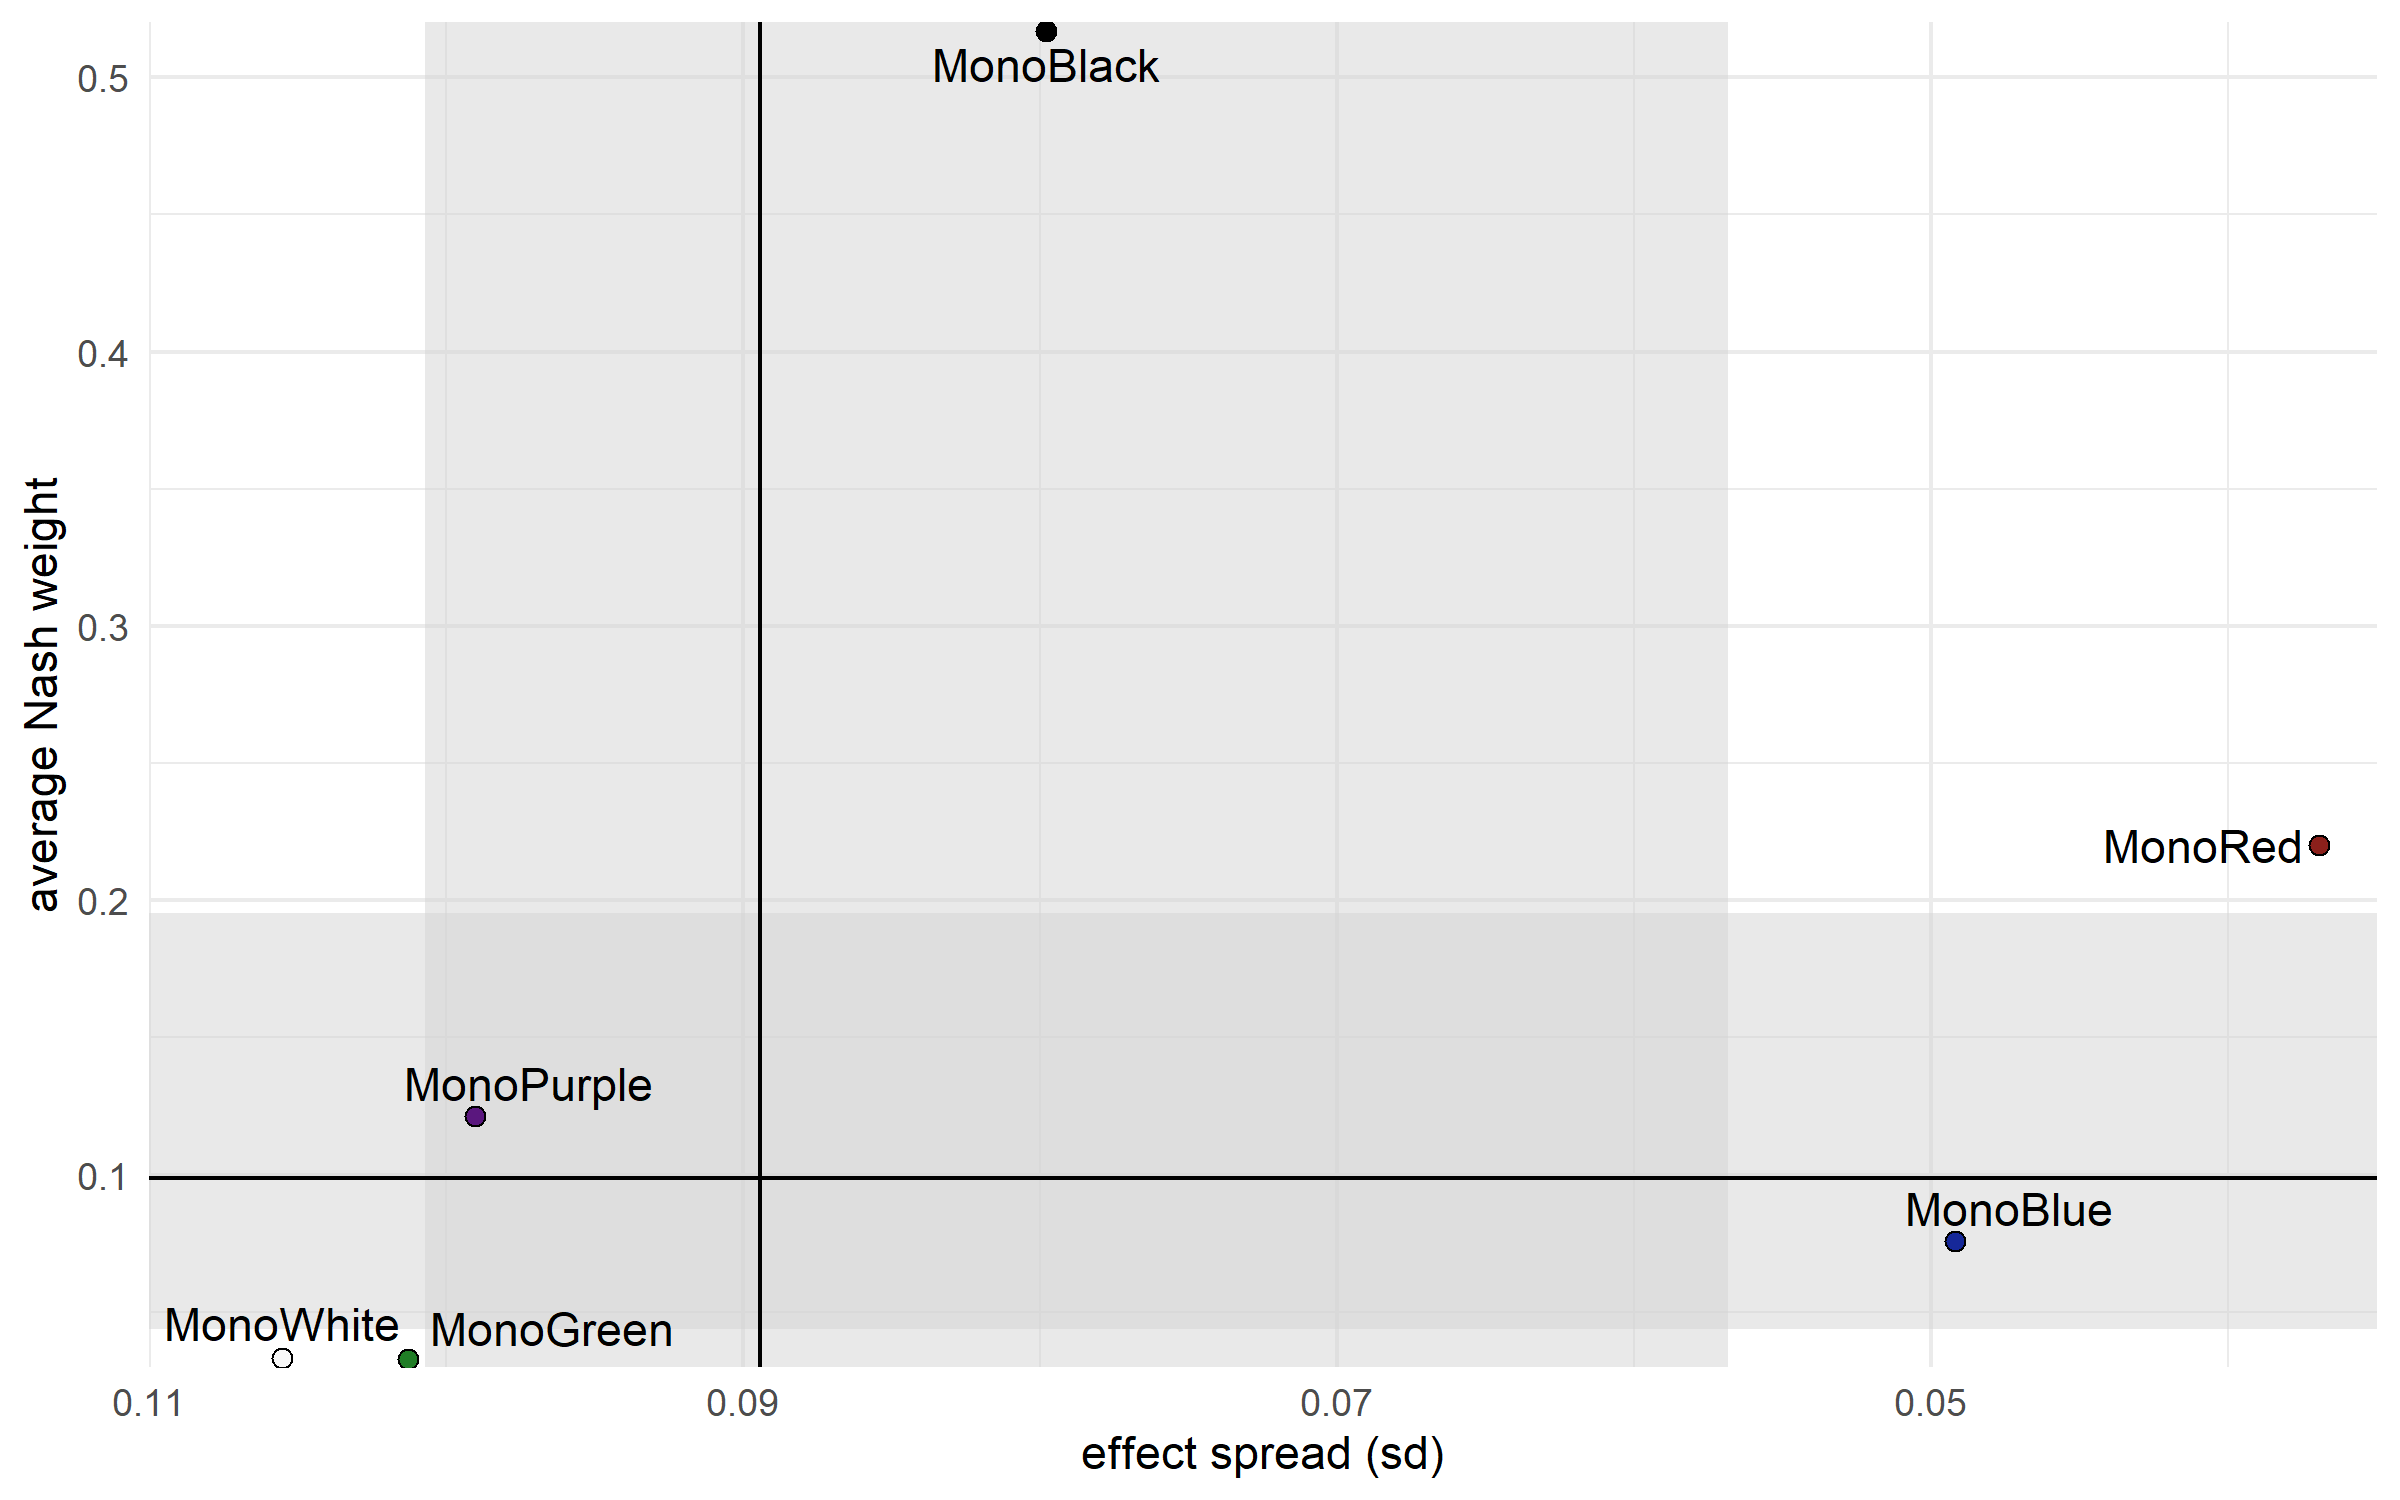
Each one has a standard version, giving mean effect vs. effect standard deviation, where effect is the win probability for the moncolour decks and the log-odds effect for the starters and specs, and an experimental version, that uses the mean Nash weight instead of the main effect. Silmerion describes the axes as high tier / low tier vs. well-rounded / has issues.

Usual caveats:
- these reflect average play rather than optimal play because the model can’t distinguish them yet
- these use mean effects over all simulation samples, so don’t reflect the model’s uncertainty
- the model currently doesn’t account for within-deck synergies at all
- the Nash results are lagging behind everything else because calculating them currently takes ages