This is amazing stuff! (In truth, after most of the statistics details in the first few posts went over my head, I didn’t even attempt to understand what was going on inside your models. However, just the amount of time this must’ve taken is impressive)
I was wondering why you haven’t gathered more data from non-tournament matches. Is it because of the time involved (in that collecting match data from a tournament must be much more efficient than scanning loads of different threads) or is it because you feel the data from casual matches won’t be as representative of true match-up advantages as players will try weirder strategies or not focus as much?
Good question! It’s a mixture of both. The main goal for the model is to work out how good the starters and specs are in high-level play, so limiting things to tournament results seems the best way to do that. It also meant I could go back and capture all the historical data without going insane.
If I went back to add casual matches, I’d want the process to be automated, and that’s not easy to do for forum threads, as opposed to a digital version: the end of the match needn’t coincide with the last posts in the thread, or there may be a finals thread where the last two players play several matches without starting new threads, or people occasionally do follow-up casual matches in the same thread, or people misspell their own name in the thread name, or the thread name gives the wrong decks, etc. If a digital version appeared, a lot of these problems disappear.
What wouldn’t disappear is that occasionally I need to make a judgement call on whether a match should be included in the model: matches won on timeout aren’t currently included, but I also exclude matches by marking them as a forfeit, for reasons that can’t always be generalised. For example, this match is a clear candidate for removing, since skiTTer resigned on turn 1 when she saw she was facing Nightmare, so it has no information regarding deck strengths. More subjectively I’ve also excluded a lot of one player’s games (petE), because they realised they’d been playing incorrectly since they’d joined.
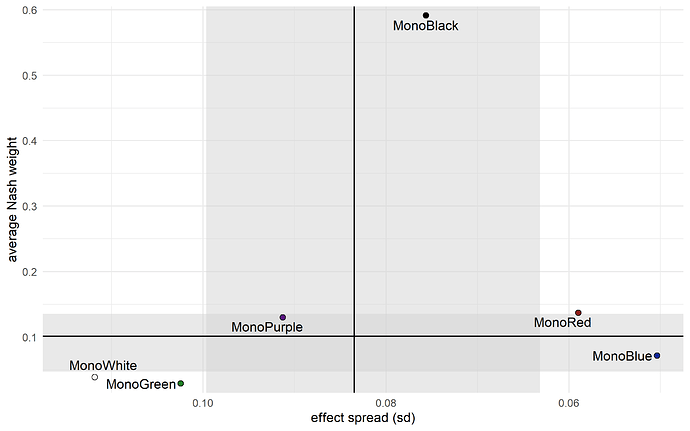
I don’t know how much it would affect things to add casual match data too, but see the monocolour matchup plot for Metalize’s data three posts up to see what sort of effect it might have.
Final CAMS prediction results are up. I’ll write a post about them when I have time, but generally the model did pretty well.
Just before I posted this, I realised I had a few matches where I’d recorded players with the wrong decks, so I had to go back and fix my automated data checks. It doesn’t seem to have changed the results much.
For those who are interested, I’ve split off the data, data checks, and deck name converters, into a separate module, and put it on Github here.
Calibration
We’re giving the win probability for Player 1 in each match, not just the favoured player. If the model thinks the match is 7-3, we expect to see Player 1 win 70% of those matches, not all of them.
This means that, on the plot giving P1 win probabilities, we expect the P2 wins to gradually become more common as the probability decreases, not a sharp cut-off at 50%.
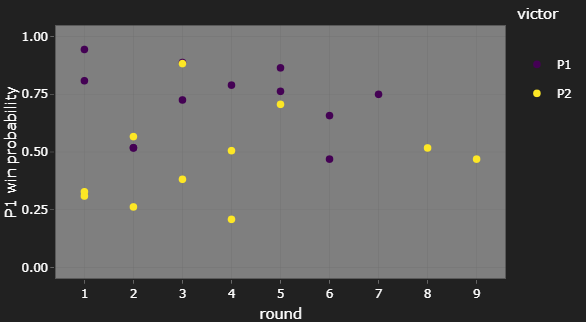
This is roughly what we see. That P2 victory at c. 85% P1 win probability in round 3 is an upset, sure, but we expect to see an few upsets at that probability level.
(If you’re wondering why round 2 only seems to have 3 matches, that purple dot in is actually two purple dots right on top of each other.)
The only thing I’d be concerned with here is that we don’t see any P1 wins at low probabilities. However, there weren’t many matches that favoured P2 anyway, so this might just be due to random chance, given the low sample size.
Match closeness in late tournament
One thing I’ve been interested in tracking on this tournament tracker is whether we see matches in later rounds being more fair, i.e. closer to 50% P1 win probability, as the field narrows to the most competitive player/deck pairings.
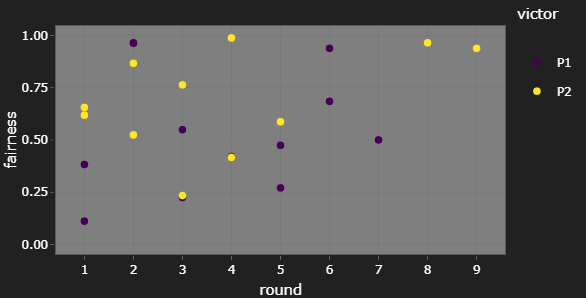
For CAMS20, I’m not really convinced this was the case. However, the number of matches seen at later rounds is always lower, so this could be to random chance too. To get a better idea of how fairness changes as a tournament goes on, I’d have to look at several tournaments at once, unless we get a tournament with several dozen players.
Brier score
Reminder: the Brier score is a number between 0 and 1; the smaller the Brier score, the better. It’s a proper scoring rule: if you knew the true result probability, you optimise your expected score by giving that true probability as your prediction. If you give a prediction of 5-5, you’re guaranteed a score of 0.25, so this is a good benchmark that your predictions should improve on.
On the evaluation page, I give both the observed Brier score, and the “prior expected score”: assuming the predictions are correct, what is the average score we’d expect to see? This assumes the matches are fixed, so ignores the fact that, if matches had ended differently, we’d see different matches later.
| forecast | Brier score |
|---|---|
| always 5-5 | 0.250 |
| prior expected score | 0.194 |
| model | 0.173 |
The model is clearly doing better than flipping a coin. But how much better? I personally find it quite hard to tell when there are several models to compare, let alone when we’re looking at the score for a single model. Next time, I’m going to break the score up into more intuitive parts, and see whether that helps.
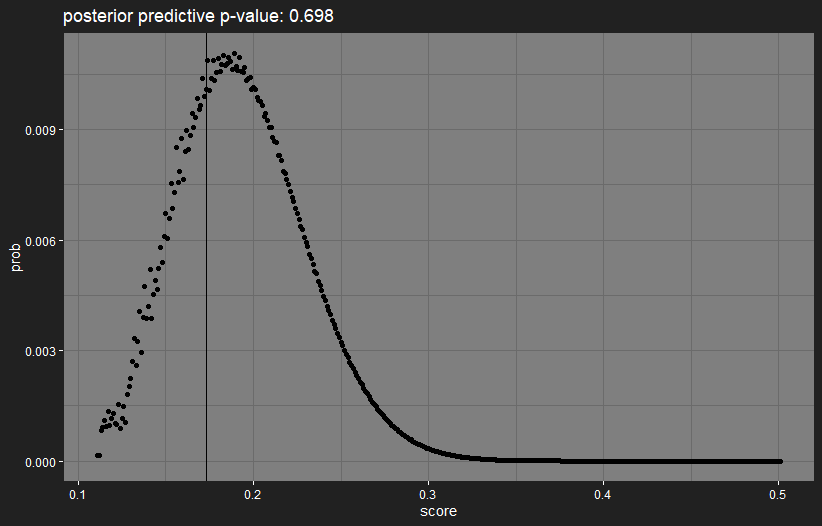
However, if we again assume that the model’s predictions are correct, we can look at how likely we are to see the observed score. If it turns out to be highly extreme, then the model is way off in its predictions. Since we can calculate the exact distribution of the score if the predictions are correct, we can plot the distribution, with a vertical line indicating the observed value:
The observed score is in a highly-likely region, so there’s no reason from this to think that the model is doing something badly wrong.
Current plans
Still, I’m not quite happy with the model as it stands. There’s no accounting for synergies between starters/specs in a deck whatsoever, which should have a huge effect on a deck’s strength. The absence of synergies is probably why there are some odd results, like Nightmare and Miracle Grow not being considered especially great decks.
I’m looking to have a new model version that includes within-deck synergies by CAWS20. But first, I’ll be adding handling for the “new” starters/specs that will be appearing in XCAFS20. I won’t be doing predictions while it’s on, since there’s no starter/spec match history for the model to work with.
The new model version will take a while, so in the meantime I’ve added some more plots/tables for the monocolour matchups. There are now matchup evaluations averaged over turn order (“general matchup”), and evaluations for how dependent matchups are on who goes first.
As usual, more results on the site (this page), so here are some stand-outs:
Fairest general matchups (apart from mirrors, which are always perfectly fair):
| Deck 1 | Deck 2 | Deck 1 win probability | matchup | fairness |
|---|---|---|---|---|
| MonoGreen | MonoRed | 0.500 | 5.0-5.0 | 1.00 |
| MonoBlue | MonoPurple | 0.540 | 5.4-4.6 | 0.92 |
| MonoPurple | MonoRed | 0.459 | 4.6-5.4 | 0.92 |
| MonoBlue | MonoGreen | 0.456 | 4.6-5.4 | 0.91 |
| MonoBlue | MonoWhite | 0.451 | 4.5-5.5 | 0.90 |
Unfairest general matchups:
| Deck 1 | Deck 2 | Deck 1 win probability | matchup | fairness |
|---|---|---|---|---|
| MonoBlack | MonoGreen | 0.722 | 7.2-2.8 | 0.56 |
| MonoPurple | MonoWhite | 0.680 | 6.8-3.2 | 0.64 |
| MonoBlack | MonoWhite | 0.627 | 6.3-3.7 | 0.75 |
| MonoBlack | MonoBlue | 0.604 | 6.0-4.0 | 0.79 |
| MonoRed | MonoWhite | 0.412 | 4.1-5.9 | 0.82 |
Surprise surprise, Black has many of the most lopsided matchups.
Fairest matchups WRT turn order:
| Deck 1 | Deck 2 | P1 win probability | matchup | fairness |
|---|---|---|---|---|
| MonoPurple | MonoWhite | 0.507 | 5.1-4.9 | 0.99 |
| MonoBlack | MonoPurple | 0.509 | 5.1-4.9 | 0.98 |
| MonoGreen | MonoGreen | 0.487 | 4.9-5.1 | 0.97 |
| MonoRed | MonoRed | 0.481 | 4.8-5.2 | 0.96 |
| MonoBlack | MonoGreen | 0.478 | 4.8-5.2 | 0.96 |
Most P1-slanted matchups:
| P1 | P2 | P1 win probability | matchup | fairness |
|---|---|---|---|---|
| MonoBlue | MonoGreen | 0.757 | 7.6-2.4 | 0.49 |
| MonoBlack | MonoWhite | 0.696 | 7.0-3.0 | 0.61 |
| MonoWhite | MonoWhite | 0.668 | 6.7-3.3 | 0.66 |
| MonoBlack | MonoRed | 0.642 | 6.4-3.6 | 0.72 |
| MonoRed | MonoWhite | 0.612 | 6.1-3.9 | 0.78 |
Most P2-slanted matchups:
| P1 | P2 | P1 win probability | matchup | fairness |
|---|---|---|---|---|
| MonoGreen | MonoPurple | 0.309 | 3.1-6.9 | 0.62 |
| MonoPurple | MonoPurple | 0.391 | 3.9-6.1 | 0.78 |
| MonoBlue | MonoPurple | 0.411 | 4.1-5.9 | 0.82 |
| MonoBlack | MonoBlue | 0.456 | 4.6-5.4 | 0.91 |
| MonoBlue | MonoBlue | 0.466 | 4.7-5.3 | 0.93 |
The above results don’t account for uncertainty at all, I’m just using the mean matchup. Comments welcome.
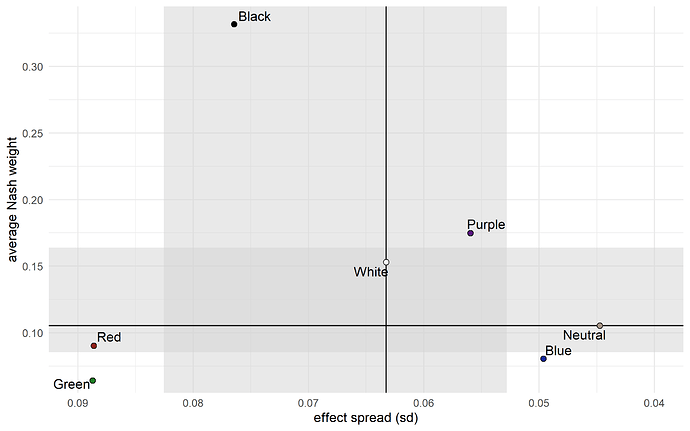
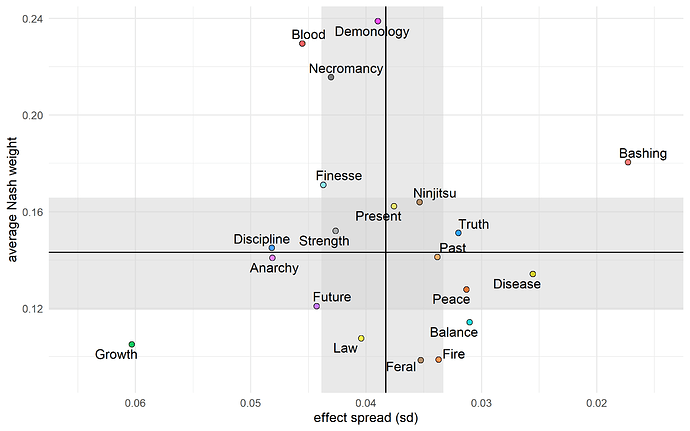
I’ve updated the Nash equilibria again, here are the 2D “tier lists” with the resulting Nash weights.
Strength, Growth, and Balance are down. Ninjitsu (?), Bashing (??), Blood, and Demonology are up.
Why is Bashing so high on this plot? Is this reflecting the re balance tourney?
I did some digging and compiled past tourney final match results. Is this the right pool of tourneys to collect data from? I was looking for standard CAS tourneys excluding experimental ones.
| YEAR | SEASON | WINNER | DECK | RUNNER-UP | DECK | WIN PLAYER | WIN STARTER | WIN COLOR | WIN NAMED |
|---|---|---|---|---|---|---|---|---|---|
| 2016 | FALL | EricF | [Past]/Peace/Anarchy | FrozenStorm | [Past]/Peace/Anarchy | P1 | Purple | Multi | Purple/Peace |
| 2016 | WINTER | petE | [Anarchy]/Strength/Growth | zhavier | [Necro]/Blood/Truth | P1 | Red | Multi | Miracle Gro |
| 2017 | SPRING | FrozenStorm | [Demon/Necro]/Finesse | Bob199 | [Strength]/Blood/Finesse | P2 | Black | Mono | Nightmare |
| 2017 | SUMMER | Jadiel | [Necro]/Anarchy/Blood | EricF | [Future]/Peace/Necro | P1 | Black | Multi | Necro/Red |
| 2017 | FALL | FrozenStorm | [Demon/Necro]/Finesse | rathyAro | [Feral]/Blood/Truth | P1 | Black | Mono | Nightmare |
| 2017 | WINTER | zhavier | [Anarchy]/Strength/Growth | FrozenStorm | [Future]/Peace/Necro | P1 | Red | Multi | Miracle Gro |
| 2018 | SUMMER | Dreamfire | [Demon]/Anarchy/Balance | zhavier | [Anarchy]/Strength/Growth | P1 | Black | Multi | ? |
| 2018 | WINTER | EricF | [Discipline]/Strength/Finesse | Marto | [Discipline]/Strength/Finesse | P1 | White | Mono | White/Finesse |
| 2019 | SUMMER | zhavier | [Anarchy]/Strength/Growth | bansa | [Law/Peace]/Finesse | P1 | Red | Multi | Miracle Gro |
| 2019 | WINTER | bolyarich | [Demon/Necro]/Finesse | codexnewb | [Anarchy]/Strength/Growth | P2 | Black | Mono | Nightmare |
| 2020 | SUMMER | FrozenStorm | [Necro]/Blood/Fire | zhavier | [Future]/Necro/Peace | P2 | Black | Multi | Necro/Red |
Assuming above is correct, these are my findings.
| MOST WINS | STARTER WINS | PLAYER WINS | NAMED WINS | ||||
|---|---|---|---|---|---|---|---|
| FrozenStorm | 3 | Black | 6 | P1 WINS | 8 | Miracle Grow | 3 |
| zhavier | 2 | Red | 3 | P2 WINS | 3 | Nightmare | 3 |
| EricF | 2 | White | 1 | Necro/Red | 2 | ||
| Purple | 1 |
Fall '17 – Winter '17 is the LDT tournaments? That looks right.
The reason Bashing ends up with such a high Nash weight is partly because of how little it’s used. As the other spec matchups are played, and their uncertainty goes down, the remaining high uncertainty for Bashing matchups means that its sampled Nash weight will sometimes be huge.
I don’t use the balance tournament in the model. It’s different enough that effectively they’re completely new starters/specs, so I’d be roughly quadrupling the modelling time.
Im not sure winning player here is a fair statistic to track, as it appears you are only comparing if they won their last game as p1 or p2. Taken over all the matches of all the tournaments, p1 is slightly favored, as i recall, but not 8-3 favored.
CAWS20 tracker is up. Let me know if you’d rather not have the predictions visible before the matches have finished.
@charnel_mouse I just checked out your website. Very impressive. Although I don’t understand most of it, it looks like valuable study. Is overall mean pick distribution predicting the winner? Surprised model weighs EricF’s deck more than Nightmare. Oh, I see. It’s because of Bashing as you explained above. So, am I reading this right? It looks like the model is predicting EricF’s win by a huge percentage. Wait, isn’t model’s choice [Demon/Necro]/Bashing then? Ohh, is that why EricF said he is messing with the model? Since we all know Bashing’s plot is prolly not real? I think I now get it. But why not Nightmare? I guess that was just your choice. Was your deck the 3rd strongest? Wait, no that is not your deck. Did you pick the weakest deck??
(Disclaimer: not a data scientist, been a long time since I took statistics)
I believe the model slightly favors Demon/Necro/Bashing over Nightmare, but just greatly favors EricF’s skill (rightfully so, his past performance against everyone is proof of it and what the model’s going off to arrive at that conclusion ![]() )
)
Model gives him best odds of being the best active player, with I believe you next @bansa, and Boly, Zhav and Persephone rounding out the top 5 but well behind you two. I don’t think that’s particularly far off reality, the skill distribution is wider for those who’ve played fewer games in the sample. I’ve played 170-ish games in that sample and the model has a fairly proven record Zhav and Eric have my number and a fair bit of data that you’ve taken about as many games off me as I have off you ![]()
FrozenStorm’s got it right. EricF’s skill level tends to make him a favourite regardless of the decks, but in this case his deck is the favourite before accounting for players. Again, Bashing gets a bit over-weighted for its high uncertainty, which I consider a feature, since this is the model automatically trying to balance exploration and exploitation. Meanwhile, Nightmare isn’t considered particularly strong, because the model doesn’t account for inter-spec synergies.
Overall mean pick distribution is something like: if you hosted a single match against another person, and you both picked a player/deck to play on your behalf, with what probability should you pick each of them? So it’s the Nash strategy for a single game, not really for winning the tournament. It shouldn’t be taken too seriously, but I thought it was interesting enough to display.
My deck has the highest pick distribution out of all possible multicolour decks, but it has the lowest among the decks in the tournament. Funny how these things work out.
Ha, you lost me there. Clearly, I don’t understand this Nash thing, thanks to my zero statistical background  Maybe I’ll do some reading on your website to try learn what they are. Thanks for the info! @FrozenStorm I think I tricked you there. Model wasn’t predicting the winner sounds like. But honored that you think highly of me
  I’ve had some success in the past tourneys I entered and I have a theory on this. I think my style of play is under-represented here in the forum and you guys were prolly like what the xxxx is this guy doing? and yeah. I might have caught you guys off guard. But you will all get used to it and it will normalize as I generate more samples. I gotta limit my all in plays to get to the next level is my assessment to myself.
I know little about statistics so not sure what can be said about fairness of statistic but I was mainly interested in finding out who were winners and winning decks in past standard CAS tourneys.
I’m a classic data guy not a sabermetrician, so to me top 3 players are clear by most wins and this was the result I wanted to confirm and it matches my experience.
P1 wins was simply an observation I made and was a byproduct. I didn’t want to draw a conclusion from it since I agree that it is not enough data to put a weight on it. It is in line with my prediction though. Maybe slightly exaggerated. My gut feeling was somewhere between 6-4 and 7-3.
As to collecting just the final match results, again, I’m a big game pitcher believer not a sabermetrician. Don’t hate me for this. I think dataset on final matches actually represents more fairness between players and decks than data on all the matches because it makes the P1-P2 data less affected by different skill levels and strongness of decks. Yea, this may sound statistically wrong but my presumption is final match is expected to see skilled players with strong decks in that particular season. Although not equally powered, they are more likely to have a fairness value(?). I could be totally wrong and randomly referencing model here in hope that it supports my argument. ![]()
I think it holds some truth though even if model proves me wrong and I want to expand my research to all the tourney matches between top players to make the dataset bigger for P1-P2 win data.
A few responses to make here.
Nash equilibria are from Game Theory, not Statistics. Simplifying to the main case we look at here, i.e. deck selection, the Nash equilibrium is what you’ll see when all the players are choosing decks (strategies) so as to make their worst-case matchup as good as possible. Each deck gets a Nash weight, and the weights sum up to one. Players randomly pick a deck, and a deck’s weight is the probability of it being picked.
Looking at just the finals is fine, but there are a few things it’ll naturally sweep under the rug. Some examples:
-
Being a good tournament player consists of at least two different measures of skill: skill at playing matches, and skill at constructing / choosing good decks. How much do you care about the latter? Players that are strong at one tend to be strong at the other.
-
Players that are very good but aren’t active often – or often go AWOL halfway through tournaments – are penalised by just counting final wins. Case in point: the model reckons Marto is most likely to be the best player – EricF is likely to be the best active player – but he doesn’t show up on tournament wins at all. Jadiel barely shows up either, even though he was also a very strong player.
-
Some of the stronger known decks have a Paper-Scissors-Stone dynamic: Nightmare is disadvantaged against Miracle Grow, which is disadvantaged against [Demonology]/Anarchy/Balance, which is disadvantaged against Nightmare. If you see one of these decks winning a tournament, is it because their counter wasn’t in the line-up that year?
Now, I’m not convinced yet, but it does look like matches in the final round tend to be more even / fair. But what are you trying to measure, that matchup fairness will help you more with? Player skill? Deck strength? A bit of both? Why do you want cases where who wins is closer to being a fair coin flip?
I was trying to agrue that dataset on final matches may reflect P1-P2 win disparity better than dataset on all tourney matches or at least have some meaning because they are less affected by different player skills or strong decks since they are presumably both skilled and both strong.
